
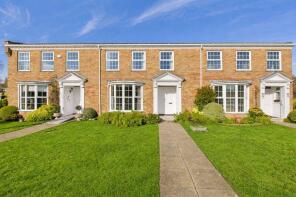
House Prices in Mudeford
House prices in Mudeford have an overall average of £465,768 over the last year.
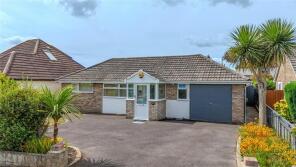
The majority of properties sold in Mudeford during the last year were detached properties, selling for an average price of £591,500. Terraced properties sold for an average of £360,315, with flats fetching £229,632.
Overall, the historical sold prices in Mudeford over the last year were 1% up on the previous year and 17% down on the 2022 peak of £560,125.
Properties Sold
5, Anson Close, Christchurch BH23 3HZ
| Today | See what it's worth now |
| 10 Apr 2026 | £305,000 |
| 26 Jul 2019 | £270,000 |
3, Lancaster Close, Christchurch BH23 4SR
| Today | See what it's worth now |
| 10 Apr 2026 | £430,000 |
| 12 Oct 2018 | £365,000 |
35, Viscount Drive, Christchurch BH23 4JN
| Today | See what it's worth now |
| 10 Apr 2026 | £535,000 |
| 21 Oct 2015 | £325,000 |
19, Ambassador Close, Christchurch BH23 4DH
| Today | See what it's worth now |
| 26 Mar 2026 | £375,000 |
| 16 Apr 2021 | £319,000 |
19, Russell Drive, Christchurch BH23 3PA
| Today | See what it's worth now |
| 26 Mar 2026 | £495,000 |
| 19 Nov 2007 | £320,000 |
No other historical records.
40, Foxwood Avenue, Christchurch BH23 3LA
| Today | See what it's worth now |
| 26 Mar 2026 | £500,000 |
| 29 Nov 2002 | £194,950 |
No other historical records.
Flat C, 18 Rook Hill Court, Rook Hill Road, Christchurch BH23 4DZ

| Today | See what it's worth now |
| 23 Mar 2026 | £510,000 |
| 10 Aug 2021 | £450,000 |
107, Rodney Drive, Christchurch BH23 3LL
| Today | See what it's worth now |
| 20 Mar 2026 | £155,000 |
| 18 Oct 2018 | £112,000 |
15, Pipers Drive, Christchurch BH23 4TR

| Today | See what it's worth now |
| 19 Mar 2026 | £670,000 |
| 19 Jul 2023 | £675,000 |
43, Foxwood Avenue, Christchurch BH23 3JZ
| Today | See what it's worth now |
| 19 Mar 2026 | £797,000 |
| 9 Feb 2018 | £380,000 |
No other historical records.
74, Russell Drive, Christchurch BH23 3TN
| Today | See what it's worth now |
| 17 Mar 2026 | £415,000 |
| 26 Jan 2015 | £250,000 |
53, Monkswell Green, Christchurch BH23 1HN
| Today | See what it's worth now |
| 17 Mar 2026 | £350,000 |
| 26 Aug 2016 | £238,000 |
No other historical records.
4, Mallard Close, Christchurch BH23 4DD
| Today | See what it's worth now |
| 16 Mar 2026 | £380,000 |
| 20 Jul 2004 | £219,950 |
No other historical records.
23, Bure Close, Christchurch BH23 4EE
| Today | See what it's worth now |
| 11 Mar 2026 | £725,000 |
| 2 Oct 1995 | £157,500 |
No other historical records.
3, Aerodrome Way, Christchurch BH23 3FJ
| Today | See what it's worth now |
| 27 Feb 2026 | £305,000 |
| 10 Aug 2017 | £260,000 |
No other historical records.
20, Dennistoun Avenue, Christchurch BH23 3QL
| Today | See what it's worth now |
| 27 Feb 2026 | £460,000 |
| 26 Aug 2004 | £240,000 |
14, Avon Run Road, Christchurch BH23 4DU
| Today | See what it's worth now |
| 20 Feb 2026 | £1,500,000 |
| 26 Aug 2025 | £930,000 |
30, Viscount Drive, Christchurch BH23 4JN
| Today | See what it's worth now |
| 12 Feb 2026 | £450,000 |
| 1 Jun 1999 | £108,000 |
No other historical records.
28, Mude Gardens, Christchurch BH23 4AR
| Today | See what it's worth now |
| 11 Feb 2026 | £250,000 |
| 20 Mar 1998 | £69,000 |
No other historical records.
32, Howard Close, Christchurch BH23 3HY
| Today | See what it's worth now |
| 3 Feb 2026 | £313,000 |
| 21 Jun 2021 | £313,000 |
Oakwood Flat 5, 78, Russell Drive, Christchurch BH23 3TN
| Today | See what it's worth now |
| 29 Jan 2026 | £260,000 |
| 9 Oct 2025 | £269,500 |
No other historical records.
44, Mudeford Lane, Christchurch BH23 3HP
| Today | See what it's worth now |
| 23 Jan 2026 | £440,000 |
| 26 Apr 2013 | £250,000 |
No other historical records.
1, Halifax Way, Christchurch BH23 4TX

| Today | See what it's worth now |
| 21 Jan 2026 | £465,000 |
| 31 Oct 2008 | £215,000 |
Source Acknowledgement: © Crown copyright. England and Wales house price data is publicly available information produced by the HM Land Registry.This material was last updated on 9 July 2026. It covers the period from 1 January 1995 to 30 April 2026 and contains property transactions which have been registered during that period. Contains HM Land Registry data © Crown copyright and database right 2026. This data is licensed under the Open Government Licence v3.0.
Disclaimer: Rightmove.co.uk provides this HM Land Registry data "as is". The burden for fitness of the data relies completely with the user and is provided for informational purposes only. No warranty, express or implied, is given relating to the accuracy of content of the HM Land Registry data and Rightmove does not accept any liability for error or omission. If you have found an error with the data or need further information please contact HM Land Registry.
Permitted Use: Viewers of this Information are granted permission to access this Crown copyright material and to download it onto electronic, magnetic, optical or similar storage media provided that such activities are for private research, study or in-house use only. Any other use of the material requires the formal written permission of Land Registry which can be requested from us, and is subject to an additional licence and associated charge.
Rightmove takes no liability for your use of, or reliance on, Rightmove's Instant Valuation due to the limitations of our tracking tool listed here. Use of this tool is taken entirely at your own risk. All rights reserved.