
House Prices in Southbourne
House prices in Southbourne have an overall average of £442,274 over the last year.
The majority of properties sold in Southbourne during the last year were detached properties, selling for an average price of £613,088. Flats sold for an average of £273,607, with semi-detached properties fetching £424,131.
Overall, the historical sold prices in Southbourne over the last year were similar to the previous year and 5% down on the 2023 peak of £463,397.
Properties Sold
11, 88 90 St Nicholas Court, Belle Vue Road, Bournemouth BH6 3EL
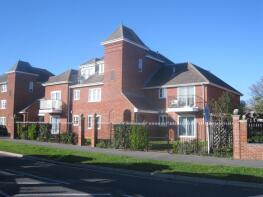
| Today | See today's value |
| 21 Aug 2026 | £225,000 |
| 1 Feb 2001 | £118,950 |
No other historical records.
2, 13 Seabreeze, Burtley Road, Bournemouth BH6 4AP
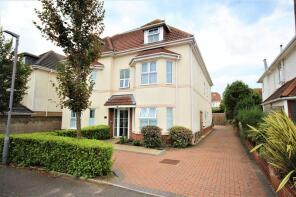
| Today | See today's value |
| 17 Aug 2026 | £295,000 |
| 28 Nov 2019 | £245,000 |
16, Thornbury Road, Bournemouth BH6 4HP
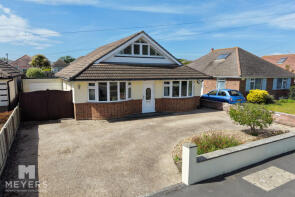
| Today | See today's value |
| 14 Aug 2026 | £680,000 |
| 24 Aug 2012 | £425,000 |
61, Cranleigh Road, Bournemouth BH6 5JU
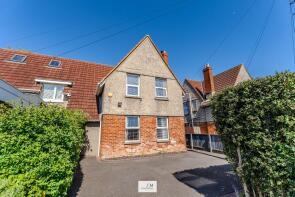
| Today | See today's value |
| 14 Aug 2026 | £385,000 |
| 18 Jun 2007 | £212,000 |
No other historical records.
84, Iford Lane, Bournemouth BH6 5QZ
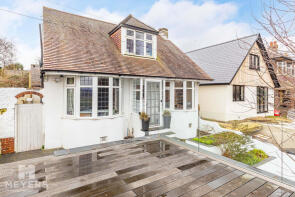
| Today | See today's value |
| 14 Aug 2026 | £461,500 |
| 30 Apr 2015 | £320,000 |
61b, Arnewood Road, Bournemouth BH6 5DN
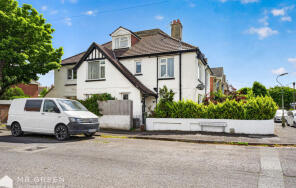
| Today | See today's value |
| 14 Aug 2026 | £245,000 |
| 7 Jun 2019 | £210,000 |
No other historical records.
31, Ravine Road, Bournemouth BH5 2DT

| Today | See today's value |
| 13 Aug 2026 | £800,000 |
| 14 Jun 2023 | £775,000 |
22, Arnewood Road, Bournemouth BH6 5DG
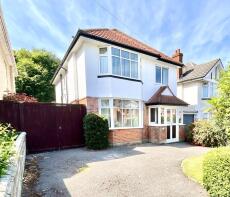
| Today | See today's value |
| 13 Aug 2026 | £515,000 |
| 13 Aug 1996 | £91,000 |
No other historical records.
6, Newcombe Road, Bournemouth BH6 5LX

| Today | See today's value |
| 10 Aug 2026 | £485,000 |
| 30 Nov 2012 | £220,000 |
No other historical records.
1, St Anne's Avenue, Bournemouth BH6 3JR
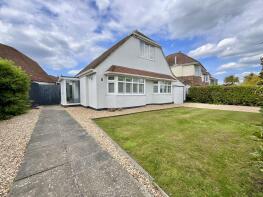
| Today | See today's value |
| 7 Aug 2026 | £595,000 |
| 23 Sep 2016 | £480,000 |
26, Paisley Road, Bournemouth BH6 5ET
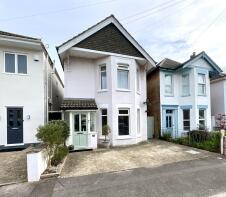
| Today | See today's value |
| 7 Aug 2026 | £515,000 |
| 11 Dec 2009 | £237,500 |
No other historical records.
Flat 31, 62 66 Avon Lodge, Southbourne Road, Bournemouth BH6 5FD
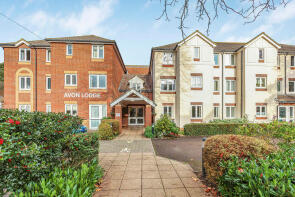
| Today | See today's value |
| 7 Aug 2026 | £85,000 |
| 12 Jun 2003 | £138,950 |
No other historical records.
144, Seabourne Road, Bournemouth BH5 2HZ
| Today | See today's value |
| 4 Aug 2026 | £145,000 |
| 10 Sep 1999 | £40,000 |
18, Harting Road, Bournemouth BH6 5QJ
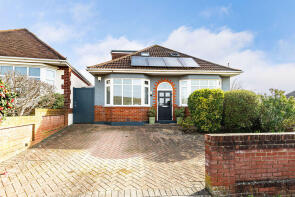
| Today | See today's value |
| 3 Aug 2026 | £495,000 |
| 9 Apr 2021 | £450,000 |
Flat 1, 147 Cape House, Belle Vue Road, Bournemouth BH6 3EN
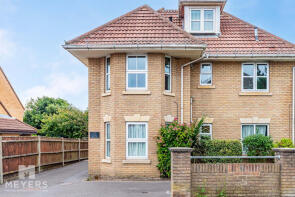
| Today | See today's value |
| 3 Aug 2026 | £215,000 |
| 30 Nov 2009 | £150,000 |
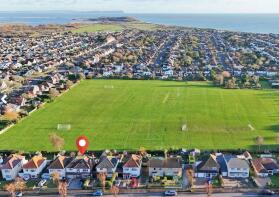
14, Sunnylands Avenue, Bournemouth BH6 4HH
| Today | See today's value |
| 29 Jul 2026 | £900,000 |
| 10 Apr 2015 | £545,000 |
24, Stourvale Road, Bournemouth BH5 2JZ

| Today | See today's value |
| 28 Jul 2026 | £410,000 |
| 21 Nov 2022 | £442,000 |
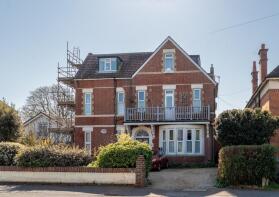
Flat 2, 89, Southbourne Road, Bournemouth BH6 3QL
| Today | See today's value |
| 27 Jul 2026 | £316,000 |
| 1 Sep 2009 | £150,000 |
No other historical records.
21, Harland Road, Bournemouth BH6 4DN

| Today | See today's value |
| 24 Jul 2026 | £978,500 |
| 19 Nov 1996 | £171,000 |
No other historical records.
39, Livingstone Road, Bournemouth BH5 2AS
| Today | See today's value |
| 24 Jul 2026 | £465,000 |
| 17 Dec 2021 | £235,000 |
3, Solent View, Solent Road, Bournemouth BH6 4BS

| Today | See today's value |
| 24 Jul 2026 | £840,000 |
| 23 Dec 2004 | £396,000 |
No other historical records.
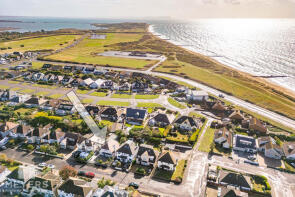
7, Solent Road, Bournemouth BH6 4BP
| Today | See today's value |
| 24 Jul 2026 | £738,000 |
| 12 Oct 2015 | £530,000 |
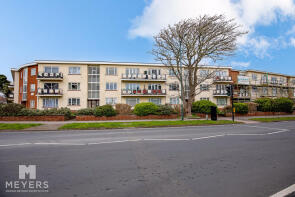
2, Belle Vue Mansions, Belle Vue Road, Bournemouth BH6 3EJ
| Today | See today's value |
| 20 Jul 2026 | £202,500 |
No other historical records.
Rightmove takes no liability for your use of, or reliance on, Rightmove's Instant Valuation due to the limitations of our tracking tool listed here. Use of this tool is taken entirely at your own risk. All rights reserved.