
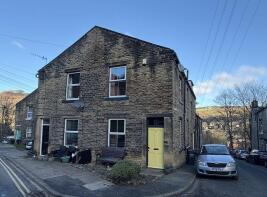
House Prices in Mytholm
House prices in Mytholm have an overall average of £266,868 over the last year.
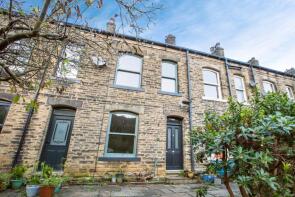
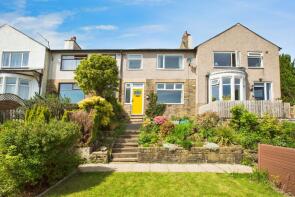
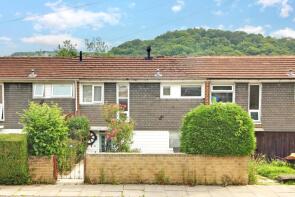
The majority of properties sold in Mytholm during the last year were terraced properties, selling for an average price of £254,035. Semi-detached properties sold for an average of £341,250, with detached properties fetching £330,000.
Overall, the historical sold prices in Mytholm over the last year were similar to the previous year and 6% down on the 2023 peak of £284,767.
Properties Sold
7, Palace House Road, Hebden Bridge HX7 6HW
| Today | See what it's worth now |
| 23 Mar 2026 | £197,500 |
| 7 May 2021 | £151,559 |
7, Brunswick Street, Hebden Bridge HX7 6AJ
| Today | See what it's worth now |
| 25 Feb 2026 | £165,000 |
| 27 Sep 2013 | £115,000 |
13, Adelaide Street, Hebden Bridge HX7 6BT
| Today | See what it's worth now |
| 13 Feb 2026 | £310,000 |
| 11 Dec 2014 | £175,000 |
11, Eton Street, Hebden Bridge HX7 6LW
| Today | See what it's worth now |
| 10 Feb 2026 | £170,000 |
| 15 Aug 2002 | £59,950 |
No other historical records.
Westwood, Palace House Road, Hebden Bridge HX7 6HW
| Today | See what it's worth now |
| 6 Feb 2026 | £487,500 |
| 23 Jul 2004 | £230,000 |
14, Hangingroyd Road, Hebden Bridge HX7 6AH
| Today | See what it's worth now |
| 6 Feb 2026 | £235,000 |
| 14 Sep 2021 | £220,000 |
15, Mason Street, Hebden Bridge HX7 6AW
| Today | See what it's worth now |
| 2 Feb 2026 | £342,500 |
| 7 Dec 2021 | £206,500 |
8, Eaves Avenue, Hebden Bridge HX7 6DJ
| Today | See what it's worth now |
| 30 Jan 2026 | £276,000 |
| 26 Oct 2001 | £54,000 |
No other historical records.
6, Beechwood View, Oakville Road, Hebden Bridge HX7 6NR

| Today | See what it's worth now |
| 23 Jan 2026 | £300,000 |
| 22 Nov 2016 | £212,500 |
27, Adelaide Street, Hebden Bridge HX7 6BT
| Today | See what it's worth now |
| 20 Jan 2026 | £295,000 |
| 24 Feb 2023 | £216,500 |
No other historical records.
6, Woodland Dell, Halifax Road, Charlestown, Hebden Bridge HX7 6NJ

| Today | See what it's worth now |
| 19 Dec 2025 | £140,000 |
| 10 Nov 2011 | £110,500 |
No other historical records.
6, Glen View, Glen View Road, Hebden Bridge HX7 6DB
| Today | See what it's worth now |
| 18 Dec 2025 | £165,000 |
| 20 Dec 2002 | £102,000 |
17, Oxford Street, Hebden Bridge HX7 6LL
| Today | See what it's worth now |
| 17 Dec 2025 | £185,000 |
No other historical records.
1, Groudle Glen, Halifax Road, Charlestown, Hebden Bridge HX7 6NN
| Today | See what it's worth now |
| 5 Dec 2025 | £200,000 |
| 3 Oct 2016 | £156,000 |
4, Eton Street, Hebden Bridge HX7 6LW
| Today | See what it's worth now |
| 5 Dec 2025 | £175,000 |
| 24 Oct 2000 | £37,000 |
No other historical records.
1, Acorn Close, Oakville Road, Hebden Bridge HX7 6QA

| Today | See what it's worth now |
| 2 Dec 2025 | £400,000 |
| 27 Nov 2020 | £255,000 |
13, Mason Street, Hebden Bridge HX7 6AW
| Today | See what it's worth now |
| 2 Dec 2025 | £450,000 |
| 23 Feb 2018 | £274,500 |
13, Queens Terrace, Hebden Bridge HX7 6BD
| Today | See what it's worth now |
| 21 Nov 2025 | £190,000 |
| 1 Jul 2016 | £70,000 |
5, Woodland Dell, Halifax Road, Charlestown, Hebden Bridge HX7 6NJ
| Today | See what it's worth now |
| 21 Nov 2025 | £156,000 |
| 30 Nov 1999 | £29,000 |
No other historical records.
4, The Dell, Eaves Road, Hebden Bridge HX7 6DP
| Today | See what it's worth now |
| 7 Nov 2025 | £300,000 |
No other historical records.
21, Palace House Road, Hebden Bridge HX7 6HW
| Today | See what it's worth now |
| 4 Nov 2025 | £270,000 |
| 29 Jun 2007 | £160,000 |
No other historical records.
1, Fountain Street, Hebden Bridge HX7 6HE
| Today | See what it's worth now |
| 17 Oct 2025 | £192,500 |
| 14 Mar 2008 | £125,000 |
9, Ingle Dene, Charlestown, Hebden Bridge HX7 6PQ
| Today | See what it's worth now |
| 13 Oct 2025 | £367,500 |
| 25 Mar 2024 | £375,000 |
Source Acknowledgement: © Crown copyright. England and Wales house price data is publicly available information produced by the HM Land Registry.This material was last updated on 9 July 2026. It covers the period from 1 January 1995 to 30 April 2026 and contains property transactions which have been registered during that period. Contains HM Land Registry data © Crown copyright and database right 2026. This data is licensed under the Open Government Licence v3.0.
Disclaimer: Rightmove.co.uk provides this HM Land Registry data "as is". The burden for fitness of the data relies completely with the user and is provided for informational purposes only. No warranty, express or implied, is given relating to the accuracy of content of the HM Land Registry data and Rightmove does not accept any liability for error or omission. If you have found an error with the data or need further information please contact HM Land Registry.
Permitted Use: Viewers of this Information are granted permission to access this Crown copyright material and to download it onto electronic, magnetic, optical or similar storage media provided that such activities are for private research, study or in-house use only. Any other use of the material requires the formal written permission of Land Registry which can be requested from us, and is subject to an additional licence and associated charge.
Rightmove takes no liability for your use of, or reliance on, Rightmove's Instant Valuation due to the limitations of our tracking tool listed here. Use of this tool is taken entirely at your own risk. All rights reserved.