
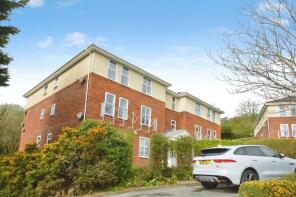
House Prices in Nadderwater
House prices in Nadderwater have an overall average of £294,667 over the last year.
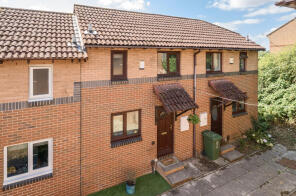
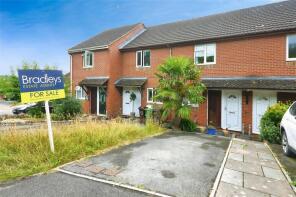
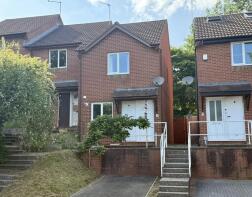
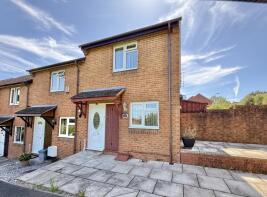
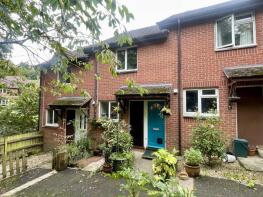
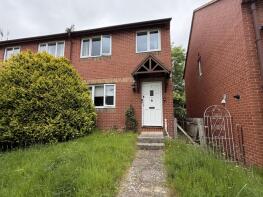
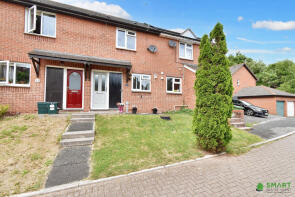
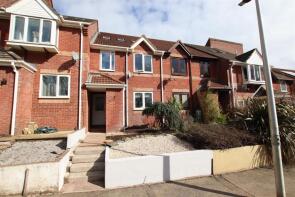
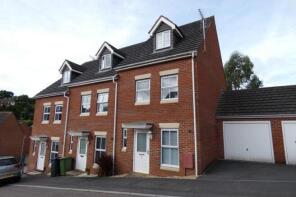
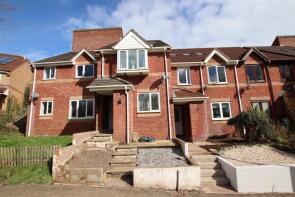
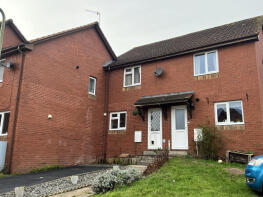
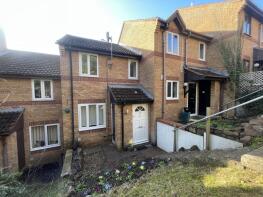
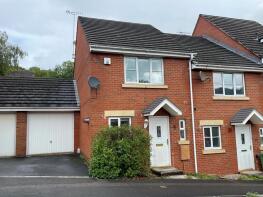
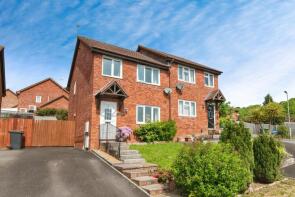
The majority of properties sold in Nadderwater during the last year were terraced properties, selling for an average price of £236,773. Detached properties sold for an average of £724,000, with semi-detached properties fetching £220,000.
Overall, the historical sold prices in Nadderwater over the last year were 18% up on the previous year and 21% up on the 2023 peak of £244,232.
Properties Sold
179, Farm Hill, Exeter EX4 2NB
| Today | See what it's worth now |
| 6 Mar 2026 | £240,000 |
| 29 Jul 2005 | £136,000 |
Trillow House, Halsfordwood Lane, Exeter EX4 2LD

| Today | See what it's worth now |
| 20 Feb 2026 | £828,000 |
| 1 Jul 2022 | £985,000 |
2, Primrose Lawn, Exeter EX4 2PH
| Today | See what it's worth now |
| 30 Jan 2026 | £210,000 |
| 30 Sep 2022 | £220,000 |
4, Poppy Close, Exeter EX4 2NZ
| Today | See what it's worth now |
| 22 Dec 2025 | £211,000 |
| 25 Nov 2019 | £174,000 |
Knights Hill, Rowhorne Road, Exeter EX4 2JE
| Today | See what it's worth now |
| 12 Dec 2025 | £620,000 |
| 14 Feb 2005 | £352,500 |
No other historical records.
14, Daisy Links, Exeter EX4 2PQ
| Today | See what it's worth now |
| 31 Oct 2025 | £203,000 |
No other historical records.
3, Kingswood Close, Exeter EX4 2PB
| Today | See what it's worth now |
| 24 Oct 2025 | £218,000 |
| 23 Nov 2001 | £78,000 |
7, Poppy Close, Exeter EX4 2NZ
| Today | See what it's worth now |
| 17 Oct 2025 | £220,000 |
No other historical records.
16, Kingswood Close, Exeter EX4 2PB
| Today | See what it's worth now |
| 12 Sep 2025 | £235,000 |
| 30 Jun 2011 | £154,950 |
40, Whitycombe Way, Exeter EX4 2NR
| Today | See what it's worth now |
| 3 Sep 2025 | £247,500 |
| 3 Aug 2018 | £195,000 |
9, Clover Avenue, Exeter EX4 2PU
| Today | See what it's worth now |
| 27 Aug 2025 | £290,000 |
| 12 Jan 2018 | £245,000 |
39, Whitycombe Way, Exeter EX4 2NR
| Today | See what it's worth now |
| 8 Aug 2025 | £247,500 |
| 18 Sep 2020 | £210,000 |
18, Kinnerton Way, Exeter EX4 2PR

| Today | See what it's worth now |
| 11 Jul 2025 | £147,500 |
| 7 Nov 2017 | £140,000 |
2, Kinnerton Way, Exeter EX4 2PP
| Today | See what it's worth now |
| 9 Jul 2025 | £295,000 |
| 12 Jun 2014 | £195,000 |
25, Medley Court, Exeter EX4 2QN

| Today | See what it's worth now |
| 27 Jun 2025 | £207,500 |
| 16 Dec 2011 | £150,000 |
3, Foxglove Rise, Exeter EX4 2PJ
| Today | See what it's worth now |
| 30 May 2025 | £215,000 |
| 19 Feb 2021 | £183,000 |
54, Thorndale Courts, Whitycombe Way, Exeter EX4 2NY
| Today | See what it's worth now |
| 23 May 2025 | £162,500 |
| 11 Mar 2022 | £142,000 |
2, Garland Close, Exeter EX4 2NS
| Today | See what it's worth now |
| 16 May 2025 | £230,000 |
| 29 Mar 2019 | £190,000 |
No other historical records.
34, Lavender Road, Exeter EX4 2PT
| Today | See what it's worth now |
| 25 Mar 2025 | £250,000 |
| 17 Jan 2020 | £217,000 |
1, Snowdrop Mews, Exeter EX4 2PN
| Today | See what it's worth now |
| 12 Mar 2025 | £277,500 |
| 1 Jul 2011 | £165,500 |
55, Thorndale Courts, Whitycombe Way, Exeter EX4 2NY
| Today | See what it's worth now |
| 13 Dec 2024 | £144,000 |
| 3 Aug 2015 | £117,000 |
4, Kingswood Close, Exeter EX4 2PB

| Today | See what it's worth now |
| 15 Nov 2024 | £185,000 |
| 29 Mar 2019 | £178,000 |
57, Thorndale Courts, Whitycombe Way, Exeter EX4 2NY
| Today | See what it's worth now |
| 23 Oct 2024 | £155,000 |
No other historical records.
Source Acknowledgement: © Crown copyright. England and Wales house price data is publicly available information produced by the HM Land Registry.This material was last updated on 15 May 2026. It covers the period from 1 January 1995 to 31 March 2026 and contains property transactions which have been registered during that period. Contains HM Land Registry data © Crown copyright and database right 2026. This data is licensed under the Open Government Licence v3.0.
Disclaimer: Rightmove.co.uk provides this HM Land Registry data "as is". The burden for fitness of the data relies completely with the user and is provided for informational purposes only. No warranty, express or implied, is given relating to the accuracy of content of the HM Land Registry data and Rightmove does not accept any liability for error or omission. If you have found an error with the data or need further information please contact HM Land Registry.
Permitted Use: Viewers of this Information are granted permission to access this Crown copyright material and to download it onto electronic, magnetic, optical or similar storage media provided that such activities are for private research, study or in-house use only. Any other use of the material requires the formal written permission of Land Registry which can be requested from us, and is subject to an additional licence and associated charge.
Map data ©OpenStreetMap contributors.
Rightmove takes no liability for your use of, or reliance on, Rightmove's Instant Valuation due to the limitations of our tracking tool listed here. Use of this tool is taken entirely at your own risk. All rights reserved.