
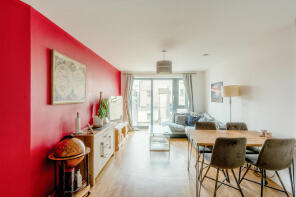
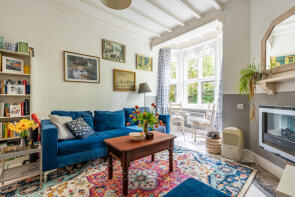
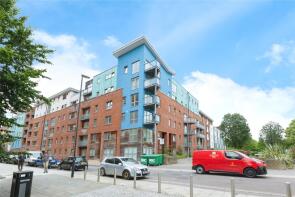
House Prices in Netham
House prices in Netham have an overall average of £242,461 over the last year.
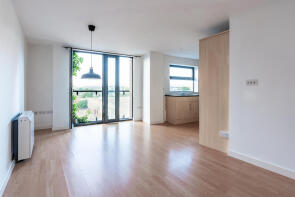
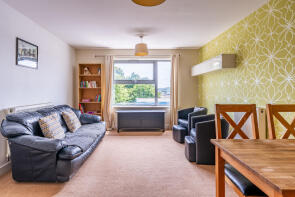
The majority of properties sold in Netham during the last year were flats, selling for an average price of £234,877. Semi-detached properties sold for an average of £330,000, with terraced properties fetching £390,000.
Overall, the historical sold prices in Netham over the last year were 4% down on the previous year and 10% down on the 2023 peak of £268,976.
Properties Sold
Flat 36, Crown And Anchor House, Sweetman Place, St Philips, Bristol BS2 0HY
| Today | See what it's worth now |
| 6 Mar 2026 | £250,000 |
No other historical records.
6, Birkin Street, St Philips, Bristol BS2 0LN
| Today | See what it's worth now |
| 27 Feb 2026 | £390,000 |
| 20 Sep 2013 | £158,000 |
Flat 13, Kings Court, Braggs Lane, Easton, Bristol BS2 0FJ
| Today | See what it's worth now |
| 27 Feb 2026 | £255,000 |
| 9 Aug 2016 | £220,000 |
No other historical records.
24, Talavera Close, St Philips, Bristol BS2 0ED
| Today | See what it's worth now |
| 13 Feb 2026 | £107,200 |
| 22 Nov 2012 | £50,000 |
Flat 17, Barstaple House, Old Market Street, St Philips, Bristol BS2 0EU
| Today | See what it's worth now |
| 13 Feb 2026 | £195,000 |
| 6 Dec 2011 | £100,000 |
No other historical records.
Flat 3, 28 Lawford Mews, Waterloo Road, St Philips, Bristol BS2 0PN
| Today | See what it's worth now |
| 16 Jan 2026 | £240,000 |
| 22 Dec 2016 | £180,000 |
1, Redcross Lane, St Pauls, Bristol BS2 0FH
| Today | See what it's worth now |
| 28 Nov 2025 | £330,000 |
| 11 Jun 2021 | £285,000 |
82, Talavera Close, St Philips, Bristol BS2 0EF
| Today | See what it's worth now |
| 28 Nov 2025 | £245,000 |
| 31 Mar 2016 | £225,250 |
50, Talavera Close, St Philips, Bristol BS2 0EF
| Today | See what it's worth now |
| 24 Nov 2025 | £265,000 |
| 3 Feb 2017 | £225,000 |
Flat 32, Cabot Court, Braggs Lane, Easton, Bristol BS2 0AX
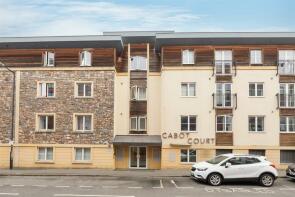
| Today | See what it's worth now |
| 7 Nov 2025 | £247,500 |
| 27 Sep 2013 | £156,000 |
No other historical records.
Flat 1, 26, Midland Road, St Philips, Bristol BS2 0JY

| Today | See what it's worth now |
| 30 Oct 2025 | £282,500 |
| 29 Sep 2015 | £225,000 |
No other historical records.
38, Talavera Close, St Philips, Bristol BS2 0ED
| Today | See what it's worth now |
| 16 Oct 2025 | £270,500 |
| 2 Jun 2020 | £240,000 |
Flat 33, 28 Lawford Mews, Waterloo Road, St Philips, Bristol BS2 0PN
| Today | See what it's worth now |
| 10 Oct 2025 | £244,000 |
| 1 Oct 2021 | £225,000 |
Flat 20, 24 Midland Mews, Waterloo Road, St Philips, Bristol BS2 0PL
| Today | See what it's worth now |
| 10 Oct 2025 | £250,000 |
| 30 Nov 2023 | £240,000 |
Flat 5, Barstaple House, Old Market Street, St Philips, Bristol BS2 0EU
| Today | See what it's worth now |
| 9 Oct 2025 | £237,500 |
| 21 Jun 2021 | £234,000 |
Flat 23, Trinity Apartments, Braggs Lane, Easton, Bristol BS2 0FS
| Today | See what it's worth now |
| 26 Sep 2025 | £293,000 |
| 9 Jul 2018 | £281,000 |
No other historical records.
Flat 26, Barstaple House, Old Market Street, St Philips, Bristol BS2 0EU
| Today | See what it's worth now |
| 23 Sep 2025 | £173,000 |
| 11 Jan 2023 | £180,000 |
Flat 10, Barstaple House, Old Market Street, St Philips, Bristol BS2 0EU
| Today | See what it's worth now |
| 19 Sep 2025 | £168,500 |
| 6 Nov 2015 | £125,950 |
Flat 24, Barstaple House, Old Market Street, St Philips, Bristol BS2 0EU
| Today | See what it's worth now |
| 12 Sep 2025 | £199,000 |
| 16 Dec 2021 | £187,500 |
Flat 108, Crown And Anchor House, Sweetman Place, St Philips, Bristol BS2 0JN
| Today | See what it's worth now |
| 10 Sep 2025 | £275,000 |
| 4 Jul 2018 | £282,000 |
No other historical records.
Flat 6, City Space, Barton Vale, St Philips, Bristol BS2 0LJ
| Today | See what it's worth now |
| 8 Sep 2025 | £365,000 |
| 30 Jul 2021 | £342,500 |
No other historical records.
21, Central Hall, Redcross Street, St Pauls, Bristol BS2 0BA
| Today | See what it's worth now |
| 5 Sep 2025 | £210,000 |
| 27 Apr 2012 | £112,000 |
No other historical records.
83, Talavera Close, St Philips, Bristol BS2 0EF
| Today | See what it's worth now |
| 5 Sep 2025 | £250,000 |
| 10 Jul 2018 | £230,000 |
Source Acknowledgement: © Crown copyright. England and Wales house price data is publicly available information produced by the HM Land Registry.This material was last updated on 15 May 2026. It covers the period from 1 January 1995 to 31 March 2026 and contains property transactions which have been registered during that period. Contains HM Land Registry data © Crown copyright and database right 2026. This data is licensed under the Open Government Licence v3.0.
Disclaimer: Rightmove.co.uk provides this HM Land Registry data "as is". The burden for fitness of the data relies completely with the user and is provided for informational purposes only. No warranty, express or implied, is given relating to the accuracy of content of the HM Land Registry data and Rightmove does not accept any liability for error or omission. If you have found an error with the data or need further information please contact HM Land Registry.
Permitted Use: Viewers of this Information are granted permission to access this Crown copyright material and to download it onto electronic, magnetic, optical or similar storage media provided that such activities are for private research, study or in-house use only. Any other use of the material requires the formal written permission of Land Registry which can be requested from us, and is subject to an additional licence and associated charge.
Rightmove takes no liability for your use of, or reliance on, Rightmove's Instant Valuation due to the limitations of our tracking tool listed here. Use of this tool is taken entirely at your own risk. All rights reserved.