
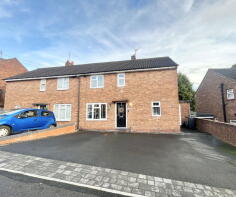
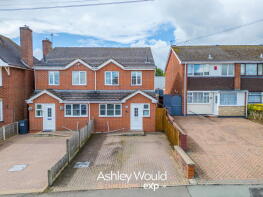
House Prices in Netherton
House prices in Netherton have an overall average of £204,403 over the last year.
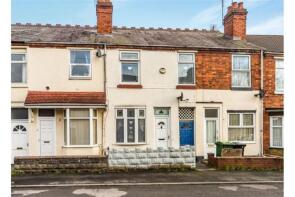
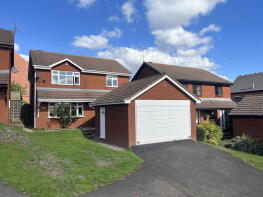
The majority of properties sold in Netherton during the last year were semi-detached properties, selling for an average price of £214,184. Terraced properties sold for an average of £189,176, with detached properties fetching £287,909.
Overall, the historical sold prices in Netherton over the last year were 5% up on the previous year and 13% up on the 2023 peak of £181,318.
Properties Sold
85, Lea Bank Road, Netherton DY2 0BD
| Today | See what it's worth now |
| 20 Mar 2026 | £220,000 |
No other historical records.
11b, Hockley Lane, Dudley DY2 0JW
| Today | See what it's worth now |
| 20 Mar 2026 | £225,000 |
| 28 Mar 2013 | £125,000 |
No other historical records.
93, Crabourne Road, Dudley DY2 0EH
| Today | See what it's worth now |
| 13 Mar 2026 | £220,000 |
| 31 Mar 2000 | £49,500 |
7, Lyttleton Close, Netherton DY2 0JR
| Today | See what it's worth now |
| 10 Mar 2026 | £70,000 |
No other historical records.
5, York Road, Dudley DY2 9LS
| Today | See what it's worth now |
| 6 Mar 2026 | £163,500 |
| 6 Feb 2009 | £62,000 |
No other historical records.
36a, Cradley Road, Dudley DY2 9RB
| Today | See what it's worth now |
| 6 Mar 2026 | £220,000 |
| 24 May 2019 | £149,000 |
No other historical records.
83, Purlin Wharf, Dudley DY2 9PQ
| Today | See what it's worth now |
| 27 Feb 2026 | £142,000 |
| 30 Sep 2021 | £115,000 |
142, Park Road, Dudley DY2 9DD
| Today | See what it's worth now |
| 27 Feb 2026 | £155,000 |
| 12 Jul 2019 | £105,000 |
96a, Church Road, Dudley DY2 0JJ
| Today | See what it's worth now |
| 19 Feb 2026 | £346,000 |
| 16 Sep 2016 | £226,000 |
33, Chichester Avenue, Dudley DY2 9JJ
| Today | See what it's worth now |
| 17 Feb 2026 | £180,000 |
| 16 Mar 2018 | £113,500 |
3, Stoney Lane, Dudley DY2 0AD
| Today | See what it's worth now |
| 10 Feb 2026 | £228,000 |
| 10 Nov 2017 | £126,000 |
45, Cradley Road, Dudley DY2 9RA
| Today | See what it's worth now |
| 9 Feb 2026 | £172,500 |
| 13 Sep 2019 | £114,950 |
6, Crossley Street, Dudley DY2 9PX
| Today | See what it's worth now |
| 9 Feb 2026 | £180,000 |
| 6 Feb 2004 | £77,500 |
18, Arch Hill Street, Netherton DY2 9QE
| Today | See what it's worth now |
| 4 Feb 2026 | £176,000 |
No other historical records.
42, Orchard Road, Netherton DY2 0DN
| Today | See what it's worth now |
| 3 Feb 2026 | £205,000 |
No other historical records.
6, Talbot Road, Dudley DY2 0HS
| Today | See what it's worth now |
| 30 Jan 2026 | £230,000 |
| 13 Mar 2019 | £147,000 |
88, Bowling Green Road, Dudley DY2 9NA
| Today | See what it's worth now |
| 30 Jan 2026 | £279,950 |
| 13 Jun 2008 | £158,000 |
1, Melvyn House, Cradley Road, Dudley DY2 9RJ
| Today | See what it's worth now |
| 30 Jan 2026 | £51,000 |
| 8 Oct 1999 | £16,000 |
No other historical records.
18, Simms Lane, Dudley DY2 0PQ
| Today | See what it's worth now |
| 22 Jan 2026 | £218,000 |
| 23 Aug 2016 | £80,000 |
No other historical records.
96, Purlin Wharf, Dudley DY2 9PG
| Today | See what it's worth now |
| 16 Jan 2026 | £230,000 |
| 21 May 2008 | £155,775 |
No other historical records.
51, Crabourne Road, Dudley DY2 0EH
| Today | See what it's worth now |
| 12 Jan 2026 | £218,000 |
| 13 Dec 2019 | £162,000 |
2, Hockley Lane, Dudley DY2 0JL
| Today | See what it's worth now |
| 12 Jan 2026 | £332,000 |
| 30 Jun 1995 | £33,000 |
No other historical records.
4, Cradley Park Road, Dudley DY2 9SR
| Today | See what it's worth now |
| 9 Jan 2026 | £246,500 |
| 13 Jul 2012 | £124,950 |
No other historical records.
16, St Johns Street, Dudley DY2 0PW
| Today | See what it's worth now |
| 8 Jan 2026 | £92,500 |
| 16 Apr 2007 | £57,000 |
No other historical records.
31, Cradley Road, Dudley DY2 9RA
| Today | See what it's worth now |
| 18 Dec 2025 | £200,000 |
| 12 Jul 2019 | £140,000 |
Source Acknowledgement: © Crown copyright. England and Wales house price data is publicly available information produced by the HM Land Registry.This material was last updated on 15 May 2026. It covers the period from 1 January 1995 to 31 March 2026 and contains property transactions which have been registered during that period. Contains HM Land Registry data © Crown copyright and database right 2026. This data is licensed under the Open Government Licence v3.0.
Disclaimer: Rightmove.co.uk provides this HM Land Registry data "as is". The burden for fitness of the data relies completely with the user and is provided for informational purposes only. No warranty, express or implied, is given relating to the accuracy of content of the HM Land Registry data and Rightmove does not accept any liability for error or omission. If you have found an error with the data or need further information please contact HM Land Registry.
Permitted Use: Viewers of this Information are granted permission to access this Crown copyright material and to download it onto electronic, magnetic, optical or similar storage media provided that such activities are for private research, study or in-house use only. Any other use of the material requires the formal written permission of Land Registry which can be requested from us, and is subject to an additional licence and associated charge.
Map data ©OpenStreetMap contributors.
Rightmove takes no liability for your use of, or reliance on, Rightmove's Instant Valuation due to the limitations of our tracking tool listed here. Use of this tool is taken entirely at your own risk. All rights reserved.