
House Prices in Netherton
House prices in Netherton have an overall average of £174,462 over the last year.
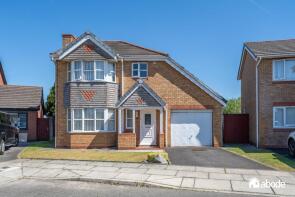
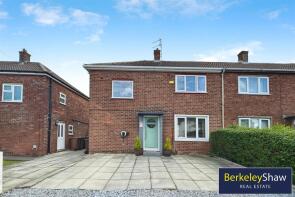
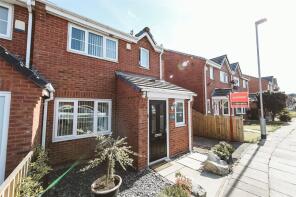
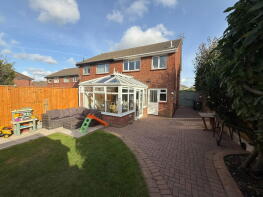
The majority of properties sold in Netherton during the last year were semi-detached properties, selling for an average price of £189,488. Terraced properties sold for an average of £141,797, with detached properties fetching £254,636.
Overall, the historical sold prices in Netherton over the last year were 8% up on the previous year and 19% up on the 2023 peak of £146,473.
Properties Sold
2, St Dunstans Grove, Bootle L30 2NH
| Today | See what it's worth now |
| 24 Apr 2026 | £155,000 |
| 30 Oct 2024 | £145,000 |
87, Longridge Drive, Bootle L30 1RA

| Today | See what it's worth now |
| 24 Apr 2026 | £207,000 |
| 31 Jul 2017 | £149,995 |
No other historical records.
8, 125 Bechers Court, Ormskirk Road, Liverpool L9 5AE
| Today | See what it's worth now |
| 17 Apr 2026 | £89,950 |
| 17 Jan 2022 | £55,000 |
21, Lunt Avenue, Bootle L30 1RT
| Today | See what it's worth now |
| 10 Apr 2026 | £250,000 |
| 10 Jan 2006 | £190,000 |
57, Park Lane West, Bootle L30 3SX
| Today | See what it's worth now |
| 10 Apr 2026 | £219,950 |
| 16 Feb 2018 | £135,000 |
45, Ronald Ross Avenue, Bootle L30 5RD
| Today | See what it's worth now |
| 2 Apr 2026 | £150,000 |
| 8 Feb 2019 | £97,500 |
33, Petersfield Close, Bootle L30 1SG
| Today | See what it's worth now |
| 31 Mar 2026 | £140,000 |
| 16 Nov 2021 | £85,000 |
No other historical records.
29, St Monicas Drive, Netherton L30 2RN
| Today | See what it's worth now |
| 30 Mar 2026 | £125,000 |
No other historical records.
47, Barberry Crescent, Bootle L30 7RS
| Today | See what it's worth now |
| 27 Mar 2026 | £350,000 |
| 1 Aug 2016 | £145,000 |
21, Marl Road, Bootle L30 8SB
| Today | See what it's worth now |
| 25 Mar 2026 | £180,000 |
| 1 May 1998 | £36,000 |
No other historical records.
1, Newark Close, Bootle L30 7QG
| Today | See what it's worth now |
| 20 Mar 2026 | £195,000 |
| 28 Jul 2004 | £115,000 |
No other historical records.
117, Lunar Drive, Netherton L30 7PN
| Today | See what it's worth now |
| 18 Mar 2026 | £268,000 |
No other historical records.
9, Hilton Court, Bootle L30 0PF
| Today | See what it's worth now |
| 12 Mar 2026 | £150,000 |
| 16 Nov 2007 | £85,000 |
32, Copy Lane, Netherton L30 8RD
| Today | See what it's worth now |
| 11 Mar 2026 | £187,500 |
No other historical records.
16, Regent Avenue, Bootle L30 6YG
| Today | See what it's worth now |
| 6 Mar 2026 | £285,000 |
| 1 Dec 2006 | £183,000 |
103, Simons Croft, Netherton L30 2RU
| Today | See what it's worth now |
| 6 Mar 2026 | £165,000 |
No other historical records.
19, Randall Drive, Bootle L30 2PA
| Today | See what it's worth now |
| 6 Mar 2026 | £180,000 |
| 11 Aug 2006 | £102,000 |
No other historical records.
51, Regent Avenue, Bootle L30 6YG
| Today | See what it's worth now |
| 27 Feb 2026 | £265,000 |
| 31 Mar 1999 | £91,000 |
No other historical records.
65, St Oswalds Lane, Bootle L30 5QE
| Today | See what it's worth now |
| 27 Feb 2026 | £171,000 |
| 2 Dec 2013 | £81,000 |
No other historical records.
45, Lunt Avenue, Bootle L30 1RT
| Today | See what it's worth now |
| 27 Feb 2026 | £145,000 |
| 13 Nov 2023 | £130,000 |
54, Apollo Way, Bootle L30 7PJ

| Today | See what it's worth now |
| 27 Feb 2026 | £190,000 |
| 25 Jan 2013 | £80,000 |
No other historical records.
30, Castleton Drive, Bootle L30 7QB
| Today | See what it's worth now |
| 27 Feb 2026 | £220,000 |
| 12 Oct 2018 | £158,000 |
7, The Threshers, Bootle L30 7QX
| Today | See what it's worth now |
| 26 Feb 2026 | £230,000 |
| 2 Apr 2015 | £111,500 |
No other historical records.
Source Acknowledgement: © Crown copyright. England and Wales house price data is publicly available information produced by the HM Land Registry.This material was last updated on 9 July 2026. It covers the period from 1 January 1995 to 30 April 2026 and contains property transactions which have been registered during that period. Contains HM Land Registry data © Crown copyright and database right 2026. This data is licensed under the Open Government Licence v3.0.
Disclaimer: Rightmove.co.uk provides this HM Land Registry data "as is". The burden for fitness of the data relies completely with the user and is provided for informational purposes only. No warranty, express or implied, is given relating to the accuracy of content of the HM Land Registry data and Rightmove does not accept any liability for error or omission. If you have found an error with the data or need further information please contact HM Land Registry.
Permitted Use: Viewers of this Information are granted permission to access this Crown copyright material and to download it onto electronic, magnetic, optical or similar storage media provided that such activities are for private research, study or in-house use only. Any other use of the material requires the formal written permission of Land Registry which can be requested from us, and is subject to an additional licence and associated charge.
Rightmove takes no liability for your use of, or reliance on, Rightmove's Instant Valuation due to the limitations of our tracking tool listed here. Use of this tool is taken entirely at your own risk. All rights reserved.