
House Prices in New Brimington
House prices in New Brimington have an overall average of £195,618 over the last year.
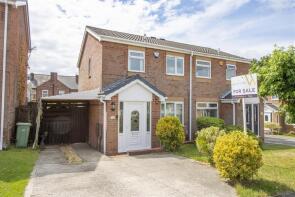
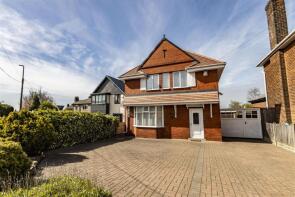
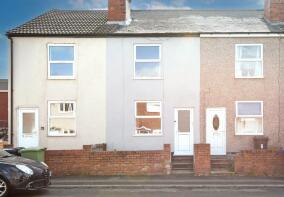
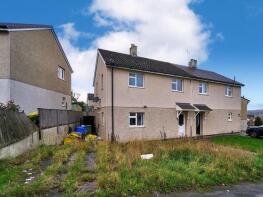
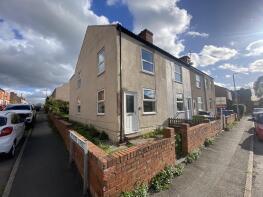
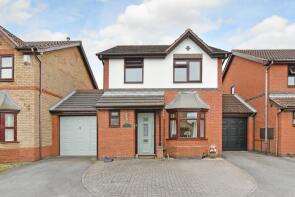
The majority of properties sold in New Brimington during the last year were semi-detached properties, selling for an average price of £178,472. Terraced properties sold for an average of £142,432, with detached properties fetching £301,485.
Overall, the historical sold prices in New Brimington over the last year were 10% down on the previous year and 4% down on the 2023 peak of £204,805.
Properties Sold
16, Victoria Street, Chesterfield S43 1HY
| Today | See what it's worth now |
| 17 Apr 2026 | £120,000 |
| 7 Mar 2006 | £88,000 |
No other historical records.
10, King Street, Brimington S43 1HX

| Today | See what it's worth now |
| 13 Apr 2026 | £145,000 |
| 31 Jan 2024 | £80,000 |
No other historical records.
152a, Manor Road, Chesterfield S43 1NW
| Today | See what it's worth now |
| 9 Apr 2026 | £417,500 |
| 9 Nov 2018 | £250,000 |
No other historical records.
4, Devonshire Park, Devonshire Street, Chesterfield S43 1GA

| Today | See what it's worth now |
| 9 Apr 2026 | £135,000 |
| 26 Aug 2022 | £127,600 |
11a, Scarsdale Crescent, Chesterfield S43 1AN
| Today | See what it's worth now |
| 2 Apr 2026 | £160,000 |
| 13 Jan 2025 | £125,000 |
260, Manor Road, Brimington S43 1NT

| Today | See what it's worth now |
| 30 Mar 2026 | £195,000 |
No other historical records.
43, Hereford Drive, Chesterfield S43 1DT

| Today | See what it's worth now |
| 27 Mar 2026 | £147,500 |
| 25 Oct 2001 | £34,500 |
No other historical records.
7, Selmer Court, Chesterfield S43 1LB
| Today | See what it's worth now |
| 16 Mar 2026 | £202,500 |
| 26 Mar 2021 | £170,000 |
No other historical records.
14, Hedley Drive, Chesterfield S43 1BF
| Today | See what it's worth now |
| 16 Mar 2026 | £195,000 |
| 26 Jun 2017 | £138,500 |
8, Chesterfield Road, Brimington S43 1AD
| Today | See what it's worth now |
| 12 Mar 2026 | £318,750 |
No other historical records.
14, Manor Avenue, Brimington S43 1NQ

| Today | See what it's worth now |
| 25 Feb 2026 | £268,000 |
No other historical records.
23, Station Road, Chesterfield S43 1JU
| Today | See what it's worth now |
| 20 Feb 2026 | £65,000 |
| 15 Nov 2013 | £90,000 |
5, Station Road, Chesterfield S43 1JH
| Today | See what it's worth now |
| 16 Feb 2026 | £420,000 |
| 26 Jul 2017 | £200,000 |
No other historical records.
10, Coronation Road, Chesterfield S43 1ET
| Today | See what it's worth now |
| 30 Jan 2026 | £123,000 |
| 31 May 2024 | £105,200 |
25, Hereford Drive, Chesterfield S43 1DT

| Today | See what it's worth now |
| 23 Jan 2026 | £150,000 |
| 14 May 2021 | £130,000 |
41, Cornwall Drive, Chesterfield S43 1EF
| Today | See what it's worth now |
| 6 Jan 2026 | £80,500 |
| 17 Aug 2016 | £54,500 |
12, Coronation Road, Chesterfield S43 1ET
| Today | See what it's worth now |
| 19 Dec 2025 | £85,500 |
| 2 Mar 2001 | £29,000 |
No other historical records.
17, Gregory Close, Chesterfield S43 1RD
| Today | See what it's worth now |
| 12 Dec 2025 | £237,500 |
| 18 Oct 1996 | £47,995 |
No other historical records.
7, Westwood Lane, Brimington S43 1PA

| Today | See what it's worth now |
| 5 Dec 2025 | £247,000 |
No other historical records.
12, Devonshire Park, Devonshire Street, Chesterfield S43 1GA
| Today | See what it's worth now |
| 5 Dec 2025 | £127,500 |
| 25 Feb 2022 | £120,000 |
25, Manor Avenue, Brimington S43 1NQ
| Today | See what it's worth now |
| 5 Dec 2025 | £240,000 |
No other historical records.
30, Chesterfield Road, Chesterfield S43 1AE

| Today | See what it's worth now |
| 5 Dec 2025 | £180,000 |
| 16 Mar 2007 | £120,000 |
30, Summerfield Crescent, Brimington S43 1HA
| Today | See what it's worth now |
| 3 Dec 2025 | £130,000 |
No other historical records.
Source Acknowledgement: © Crown copyright. England and Wales house price data is publicly available information produced by the HM Land Registry.This material was last updated on 9 July 2026. It covers the period from 1 January 1995 to 30 April 2026 and contains property transactions which have been registered during that period. Contains HM Land Registry data © Crown copyright and database right 2026. This data is licensed under the Open Government Licence v3.0.
Disclaimer: Rightmove.co.uk provides this HM Land Registry data "as is". The burden for fitness of the data relies completely with the user and is provided for informational purposes only. No warranty, express or implied, is given relating to the accuracy of content of the HM Land Registry data and Rightmove does not accept any liability for error or omission. If you have found an error with the data or need further information please contact HM Land Registry.
Permitted Use: Viewers of this Information are granted permission to access this Crown copyright material and to download it onto electronic, magnetic, optical or similar storage media provided that such activities are for private research, study or in-house use only. Any other use of the material requires the formal written permission of Land Registry which can be requested from us, and is subject to an additional licence and associated charge.
Rightmove takes no liability for your use of, or reliance on, Rightmove's Instant Valuation due to the limitations of our tracking tool listed here. Use of this tool is taken entirely at your own risk. All rights reserved.