
House Prices in New Hayward Bottom
House prices in New Hayward Bottom have an overall average of £384,919 over the last year.
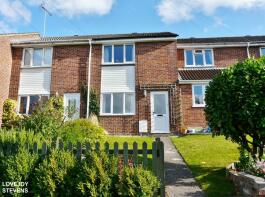
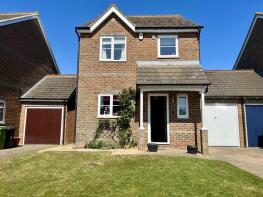
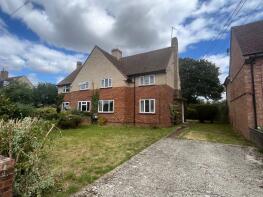
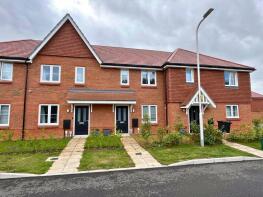
The majority of properties sold in New Hayward Bottom during the last year were terraced properties, selling for an average price of £324,750. Semi-detached properties sold for an average of £426,629, with detached properties fetching £554,250.
Overall, the historical sold prices in New Hayward Bottom over the last year were 4% down on the previous year and 14% down on the 2022 peak of £446,837.
Properties Sold
5, Coldharbour Road, Hungerford RG17 0AZ
| Today | See what it's worth now |
| 23 Apr 2026 | £202,000 |
| 30 Nov 2023 | £113,000 |
No other historical records.
37, Park Way, Hungerford RG17 0BB
| Today | See what it's worth now |
| 22 Apr 2026 | £425,000 |
| 30 Oct 1998 | £87,000 |
6, Chantry Mead, Hungerford RG17 0HT

| Today | See what it's worth now |
| 22 Apr 2026 | £270,000 |
| 9 Aug 2016 | £238,500 |
3, St Lawrence Square, Hungerford RG17 0HB

| Today | See what it's worth now |
| 1 Apr 2026 | £280,000 |
| 27 Jul 2007 | £210,000 |
8, Lancaster Close, Hungerford RG17 0DE
| Today | See what it's worth now |
| 31 Mar 2026 | £345,000 |
| 18 Nov 2013 | £210,000 |
No other historical records.
3b, Bridge Street, Hungerford RG17 0EH

| Today | See what it's worth now |
| 27 Mar 2026 | £155,000 |
| 26 Apr 2019 | £160,000 |
No other historical records.
39, Church Street, Hungerford RG17 0JH
| Today | See what it's worth now |
| 24 Mar 2026 | £420,000 |
| 13 Mar 2009 | £240,000 |
6, Chapel Court, Hungerford RG17 0HW
| Today | See what it's worth now |
| 16 Mar 2026 | £187,500 |
| 23 Oct 2015 | £182,000 |
53, High Street, Hungerford RG17 0NE
| Today | See what it's worth now |
| 16 Mar 2026 | £400,000 |
| 8 Sep 2016 | £315,000 |
1, Hillside Road, Hungerford RG17 0BH
| Today | See what it's worth now |
| 11 Mar 2026 | £534,000 |
| 28 Apr 2017 | £425,000 |
12, Kennedy Meadow, Hungerford RG17 0LR
| Today | See what it's worth now |
| 9 Mar 2026 | £374,200 |
| 25 Sep 2015 | £280,000 |
Flat 17, Foundry House, Kennet Way, Hungerford RG17 0YZ
| Today | See what it's worth now |
| 27 Feb 2026 | £182,500 |
| 7 Feb 2003 | £125,000 |
No other historical records.
15, Tarrants Hill, Hungerford RG17 0BL
| Today | See what it's worth now |
| 12 Feb 2026 | £395,000 |
| 16 Oct 2019 | £340,000 |
45, Kennedy Meadow, Hungerford RG17 0LR
| Today | See what it's worth now |
| 12 Feb 2026 | £765,000 |
| 13 May 2013 | £485,000 |
42, Kennedy Meadow, Hungerford RG17 0LR
| Today | See what it's worth now |
| 11 Feb 2026 | £825,000 |
| 5 Dec 2003 | £385,995 |
No other historical records.
33, Chilton Way, Hungerford RG17 0JR
| Today | See what it's worth now |
| 10 Feb 2026 | £307,000 |
| 22 Feb 2013 | £193,000 |
4, Hamblin Meadow, Eddington, Hungerford RG17 0HJ
| Today | See what it's worth now |
| 30 Jan 2026 | £450,000 |
| 13 Apr 2006 | £268,500 |
Apartment 1, 31 The Old Police House, Park Street, Hungerford RG17 0EA
| Today | See what it's worth now |
| 23 Jan 2026 | £435,000 |
| 10 Feb 2021 | £395,000 |
No other historical records.
31, Priory Avenue, Hungerford RG17 0BE
| Today | See what it's worth now |
| 16 Jan 2026 | £325,000 |
No other historical records.
7, Beacon Rise, Hungerford RG17 0UW
| Today | See what it's worth now |
| 14 Jan 2026 | £136,000 |
No other historical records.
17, Moores Place, Hungerford RG17 0JS
| Today | See what it's worth now |
| 18 Dec 2025 | £410,000 |
| 16 Nov 2006 | £192,000 |
14, Tarrants Hill, Hungerford RG17 0BL

| Today | See what it's worth now |
| 17 Dec 2025 | £245,000 |
| 27 May 2016 | £215,000 |
31, Coldharbour Road, Hungerford RG17 0AZ
| Today | See what it's worth now |
| 17 Dec 2025 | £347,500 |
| 2 Mar 2023 | £315,000 |
Source Acknowledgement: © Crown copyright. England and Wales house price data is publicly available information produced by the HM Land Registry.This material was last updated on 9 July 2026. It covers the period from 1 January 1995 to 30 April 2026 and contains property transactions which have been registered during that period. Contains HM Land Registry data © Crown copyright and database right 2026. This data is licensed under the Open Government Licence v3.0.
Disclaimer: Rightmove.co.uk provides this HM Land Registry data "as is". The burden for fitness of the data relies completely with the user and is provided for informational purposes only. No warranty, express or implied, is given relating to the accuracy of content of the HM Land Registry data and Rightmove does not accept any liability for error or omission. If you have found an error with the data or need further information please contact HM Land Registry.
Permitted Use: Viewers of this Information are granted permission to access this Crown copyright material and to download it onto electronic, magnetic, optical or similar storage media provided that such activities are for private research, study or in-house use only. Any other use of the material requires the formal written permission of Land Registry which can be requested from us, and is subject to an additional licence and associated charge.
Rightmove takes no liability for your use of, or reliance on, Rightmove's Instant Valuation due to the limitations of our tracking tool listed here. Use of this tool is taken entirely at your own risk. All rights reserved.