
House Prices in Newland Park
House prices in Newland Park have an overall average of £150,157 over the last year.
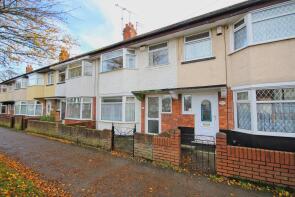
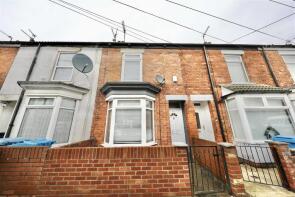
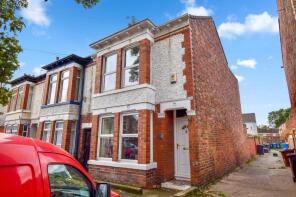
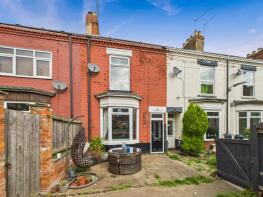
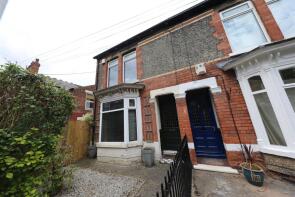
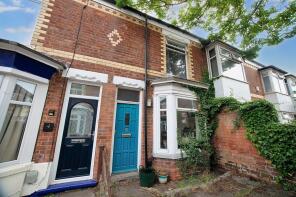
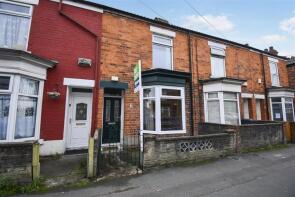
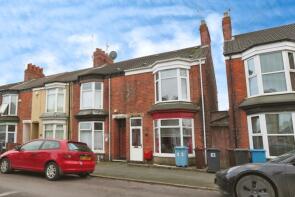
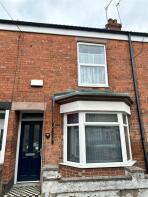
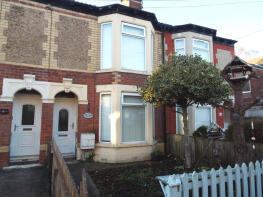
The majority of properties sold in Newland Park during the last year were terraced properties, selling for an average price of £108,257. Detached properties sold for an average of £373,250, with semi-detached properties fetching £376,667.
Overall, the historical sold prices in Newland Park over the last year were 16% up on the previous year and 16% up on the 2022 peak of £129,989.
Properties Sold
149, Goddard Avenue, Hull HU5 2BN
| Today | See what it's worth now |
| 24 Apr 2026 | £70,000 |
| 16 Dec 2020 | £94,000 |
No other historical records.
9, Ventnor Street, Hull HU5 2LP

| Today | See what it's worth now |
| 17 Apr 2026 | £100,000 |
| 28 Nov 2007 | £95,000 |
No other historical records.
2, Kirkdale Gardens, Hull HU5 2HE

| Today | See what it's worth now |
| 13 Apr 2026 | £72,000 |
| 9 Jan 2009 | £74,500 |
24, Edgecumbe Street, Hull HU5 2EU
| Today | See what it's worth now |
| 31 Mar 2026 | £115,000 |
| 16 Mar 2012 | £74,950 |
61, Goddard Avenue, Hull HU5 2AN
| Today | See what it's worth now |
| 25 Mar 2026 | £112,500 |
| 30 Jul 2021 | £110,000 |
22, Edgecumbe Street, Hull HU5 2EU
| Today | See what it's worth now |
| 6 Mar 2026 | £60,000 |
| 30 Apr 2024 | £103,000 |
No other historical records.
66, Sharp Street, Hull HU5 2AB
| Today | See what it's worth now |
| 27 Feb 2026 | £50,000 |
| 11 Mar 2022 | £109,500 |
71, Raglan Street, Hull HU5 2JA
| Today | See what it's worth now |
| 20 Feb 2026 | £92,000 |
| 16 Aug 2019 | £86,000 |
2, Alandale, Hull HU5 2BJ
| Today | See what it's worth now |
| 13 Feb 2026 | £110,000 |
| 14 Jul 2006 | £89,950 |
77, Park Grove, Princes Avenue, Hull HU5 2UR
| Today | See what it's worth now |
| 13 Feb 2026 | £207,000 |
| 15 Apr 2024 | £200,000 |
104, Newland Park, Kingston Upon Hull HU5 2DU
| Today | See what it's worth now |
| 12 Feb 2026 | £450,000 |
No other historical records.
5, Derwent Grove, Hull HU5 2SF
| Today | See what it's worth now |
| 4 Feb 2026 | £100,000 |
| 30 Jul 2021 | £87,500 |
1, Alandale, Hull HU5 2BJ
| Today | See what it's worth now |
| 4 Feb 2026 | £95,000 |
| 28 Sep 2006 | £105,000 |
4, St Augustines Avenue, Hull HU5 2QU
| Today | See what it's worth now |
| 23 Jan 2026 | £75,000 |
| 17 May 2013 | £35,000 |
5, Raglan Avenue, Hull HU5 2JB
| Today | See what it's worth now |
| 15 Jan 2026 | £85,000 |
| 7 Jul 2015 | £58,000 |
11, Edgecumbe Street, Hull HU5 2EU
| Today | See what it's worth now |
| 19 Dec 2025 | £112,000 |
| 28 Oct 2021 | £93,000 |
63, Edgecumbe Street, Hull HU5 2EX
| Today | See what it's worth now |
| 19 Dec 2025 | £121,500 |
| 25 Oct 2024 | £130,000 |
16, Melbourne Street, Hull HU5 2ET
| Today | See what it's worth now |
| 16 Dec 2025 | £105,500 |
| 2 Jun 2006 | £78,750 |
No other historical records.
11, Melbourne Street, Hull HU5 2ET

| Today | See what it's worth now |
| 16 Dec 2025 | £113,500 |
| 19 Apr 2006 | £85,000 |
42, Kirkham Drive, Hull HU5 2BT
| Today | See what it's worth now |
| 15 Dec 2025 | £170,000 |
| 11 Nov 2022 | £150,000 |
13, Clifton Gardens, Goddard Avenue, Kingston Upon Hull HU5 2AU
| Today | See what it's worth now |
| 11 Dec 2025 | £112,000 |
No other historical records.
5, Sidmouth Street, Hull HU5 2LB
| Today | See what it's worth now |
| 5 Dec 2025 | £74,000 |
| 24 Aug 2006 | £72,000 |
No other historical records.
16, Waddington Court, Hull HU5 2DA
| Today | See what it's worth now |
| 1 Dec 2025 | £65,000 |
| 21 Sep 2018 | £58,000 |
No other historical records.
Source Acknowledgement: © Crown copyright. England and Wales house price data is publicly available information produced by the HM Land Registry.This material was last updated on 9 July 2026. It covers the period from 1 January 1995 to 30 April 2026 and contains property transactions which have been registered during that period. Contains HM Land Registry data © Crown copyright and database right 2026. This data is licensed under the Open Government Licence v3.0.
Disclaimer: Rightmove.co.uk provides this HM Land Registry data "as is". The burden for fitness of the data relies completely with the user and is provided for informational purposes only. No warranty, express or implied, is given relating to the accuracy of content of the HM Land Registry data and Rightmove does not accept any liability for error or omission. If you have found an error with the data or need further information please contact HM Land Registry.
Permitted Use: Viewers of this Information are granted permission to access this Crown copyright material and to download it onto electronic, magnetic, optical or similar storage media provided that such activities are for private research, study or in-house use only. Any other use of the material requires the formal written permission of Land Registry which can be requested from us, and is subject to an additional licence and associated charge.
Rightmove takes no liability for your use of, or reliance on, Rightmove's Instant Valuation due to the limitations of our tracking tool listed here. Use of this tool is taken entirely at your own risk. All rights reserved.