
House Prices in Newthorpe
House prices in Newthorpe have an overall average of £272,185 over the last year.
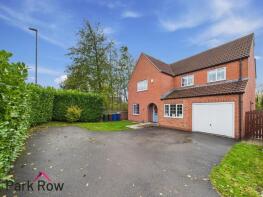
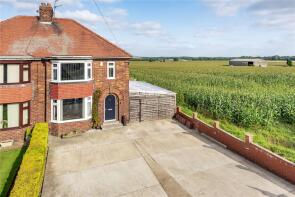
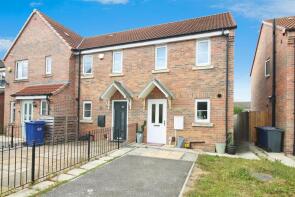
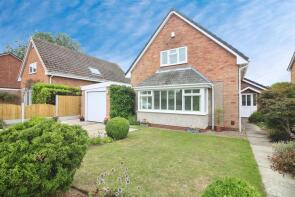
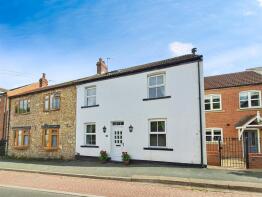
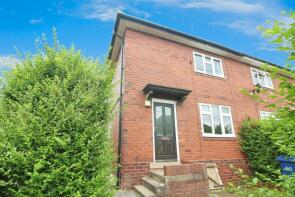
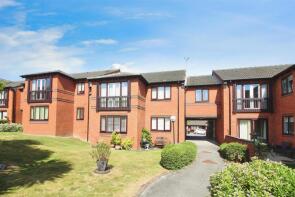
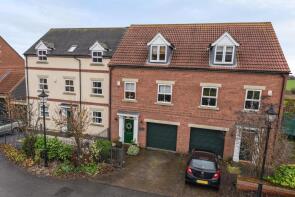
The majority of properties sold in Newthorpe during the last year were detached properties, selling for an average price of £357,757. Semi-detached properties sold for an average of £241,983, with terraced properties fetching £197,159.
Overall, the historical sold prices in Newthorpe over the last year were 3% down on the previous year and 3% down on the 2022 peak of £279,233.
Properties Sold
12, Bracken Close, Sherburn In Elmet, Leeds LS25 6PX
| Today | See what it's worth now |
| 27 Mar 2026 | £111,000 |
| 22 Oct 2021 | £93,000 |
No other historical records.
31, Low Street, Leeds LS25 6BB
| Today | See what it's worth now |
| 13 Mar 2026 | £279,000 |
| 28 Oct 2022 | £282,000 |
No other historical records.
22, Moorland Way, Leeds LS25 6FN
| Today | See what it's worth now |
| 6 Mar 2026 | £240,000 |
| 11 Dec 2009 | £171,999 |
No other historical records.
109, Low Street, Leeds LS25 6BB
| Today | See what it's worth now |
| 27 Feb 2026 | £335,000 |
| 17 Dec 2024 | £328,000 |
1, Moorland Way, Leeds LS25 6FN
| Today | See what it's worth now |
| 20 Feb 2026 | £475,000 |
| 17 Jun 2022 | £430,000 |
5, Milford Road, Leeds LS25 6AF
| Today | See what it's worth now |
| 20 Feb 2026 | £382,000 |
| 14 Feb 2022 | £330,000 |
31, Elmete Avenue, Leeds LS25 6EH
| Today | See what it's worth now |
| 19 Feb 2026 | £230,000 |
| 29 Jun 2017 | £150,000 |
19, Brunswick Crescent, Sherburn In Elmet, Leeds LS25 6GE
| Today | See what it's worth now |
| 17 Feb 2026 | £199,000 |
| 27 May 2016 | £144,999 |
No other historical records.
17, Low Garth Road, Leeds LS25 6DH
| Today | See what it's worth now |
| 6 Feb 2026 | £385,000 |
| 22 Sep 2006 | £235,000 |
No other historical records.
71, Church Hill, Leeds LS25 6AX
| Today | See what it's worth now |
| 6 Feb 2026 | £250,000 |
| 30 Sep 2016 | £190,000 |
16, Hungate Road, Sherburn In Elmet LS25 6DA
| Today | See what it's worth now |
| 30 Jan 2026 | £157,000 |
No other historical records.
64, Church View, Sherburn In Elmet LS25 6HZ
| Today | See what it's worth now |
| 29 Jan 2026 | £130,000 |
No other historical records.
8, Church Meadow, Leeds LS25 6NX
| Today | See what it's worth now |
| 22 Jan 2026 | £295,000 |
| 30 Aug 2017 | £216,000 |
18, Carousel Walk, Leeds LS25 6LP

| Today | See what it's worth now |
| 13 Jan 2026 | £110,000 |
| 6 Sep 2022 | £280,000 |
1, Baynes Row, Sherburn In Elmet, Leeds LS25 6QR
| Today | See what it's worth now |
| 5 Jan 2026 | £325,000 |
| 27 Sep 2019 | £246,950 |
No other historical records.
2, Bramley Park Avenue, Sherburn In Elmet, Leeds LS25 6FA
| Today | See what it's worth now |
| 15 Dec 2025 | £385,000 |
| 7 Feb 2025 | £360,000 |
55, Brunswick Crescent, Sherburn In Elmet, Leeds LS25 6GE
| Today | See what it's worth now |
| 12 Dec 2025 | £168,000 |
| 29 Apr 2021 | £128,000 |
No other historical records.
4, Pasture Fold, Leeds LS25 6NU
| Today | See what it's worth now |
| 12 Dec 2025 | £270,000 |
| 23 Apr 2018 | £190,500 |
11, Wolsey Croft, Leeds LS25 6DR
| Today | See what it's worth now |
| 10 Dec 2025 | £235,000 |
| 8 Sep 2015 | £142,000 |
49, Elmete Avenue, Leeds LS25 6EH
| Today | See what it's worth now |
| 5 Dec 2025 | £260,000 |
| 16 Jun 2011 | £151,000 |
28, Pinfold Way, Leeds LS25 6LF
| Today | See what it's worth now |
| 3 Dec 2025 | £230,000 |
| 13 Dec 2010 | £118,500 |
3, Braeburn Road, Sherburn In Elmet, Leeds LS25 6GF
| Today | See what it's worth now |
| 1 Dec 2025 | £295,000 |
| 3 Jun 2016 | £224,999 |
No other historical records.
24, Appletree Way, Leeds LS25 6DQ
| Today | See what it's worth now |
| 1 Dec 2025 | £195,000 |
| 15 Sep 1997 | £51,500 |
No other historical records.
Source Acknowledgement: © Crown copyright. England and Wales house price data is publicly available information produced by the HM Land Registry.This material was last updated on 15 May 2026. It covers the period from 1 January 1995 to 31 March 2026 and contains property transactions which have been registered during that period. Contains HM Land Registry data © Crown copyright and database right 2026. This data is licensed under the Open Government Licence v3.0.
Disclaimer: Rightmove.co.uk provides this HM Land Registry data "as is". The burden for fitness of the data relies completely with the user and is provided for informational purposes only. No warranty, express or implied, is given relating to the accuracy of content of the HM Land Registry data and Rightmove does not accept any liability for error or omission. If you have found an error with the data or need further information please contact HM Land Registry.
Permitted Use: Viewers of this Information are granted permission to access this Crown copyright material and to download it onto electronic, magnetic, optical or similar storage media provided that such activities are for private research, study or in-house use only. Any other use of the material requires the formal written permission of Land Registry which can be requested from us, and is subject to an additional licence and associated charge.
Rightmove takes no liability for your use of, or reliance on, Rightmove's Instant Valuation due to the limitations of our tracking tool listed here. Use of this tool is taken entirely at your own risk. All rights reserved.