
House Prices in Nook
House prices in Nook have an overall average of £219,191 over the last year.
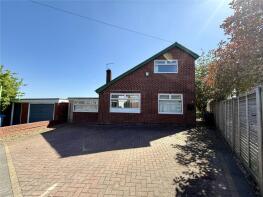
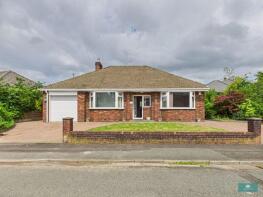
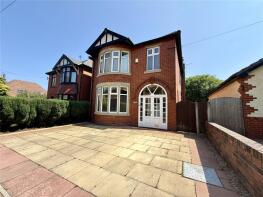
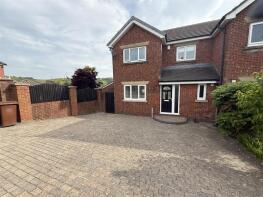
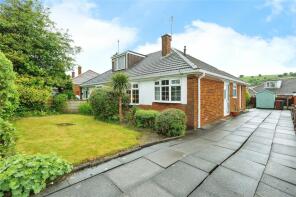
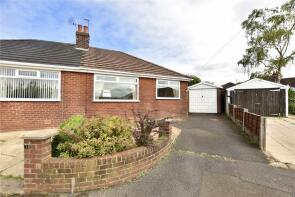
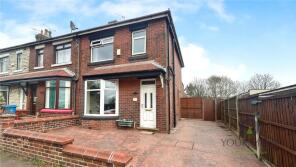
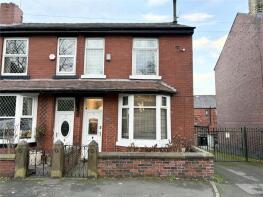
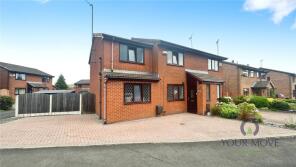
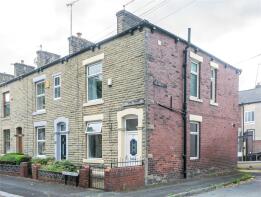
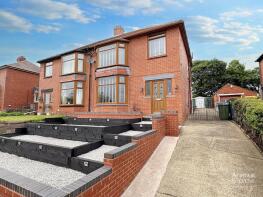
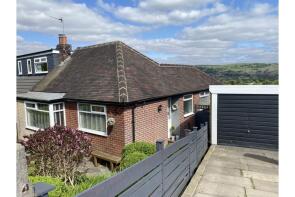
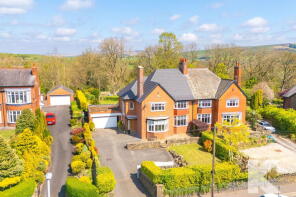
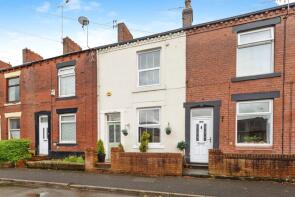
The majority of properties sold in Nook during the last year were semi-detached properties, selling for an average price of £254,721. Terraced properties sold for an average of £170,088, with detached properties fetching £280,278.
Overall, the historical sold prices in Nook over the last year were 6% up on the previous year and 8% up on the 2022 peak of £203,808.
Properties Sold
1, Warwick Close, Oldham OL2 7DZ
| Today | See what it's worth now |
| 5 Dec 2025 | £247,000 |
| 12 May 1997 | £77,000 |
No other historical records.
32, Manor Road, Oldham OL2 7JJ
| Today | See what it's worth now |
| 28 Nov 2025 | £320,000 |
| 22 Sep 2005 | £185,000 |
No other historical records.
3, Bartlett Road, Oldham OL2 7BS
| Today | See what it's worth now |
| 28 Nov 2025 | £325,000 |
| 1 Nov 1996 | £63,000 |
No other historical records.
3, Saint Josephs Close, Oldham OL2 7UZ
| Today | See what it's worth now |
| 21 Nov 2025 | £215,000 |
| 18 Jul 2008 | £139,000 |
114, Trent Road, Oldham OL2 7QH
| Today | See what it's worth now |
| 18 Nov 2025 | £215,000 |
| 1 Jun 2009 | £110,000 |
No other historical records.
4, Hereford Close, Shaw OL2 7EU
| Today | See what it's worth now |
| 17 Nov 2025 | £192,500 |
No other historical records.
13, Maple Close, Oldham OL2 7LG

| Today | See what it's worth now |
| 17 Nov 2025 | £199,950 |
| 15 Jun 2018 | £96,500 |
30, Church Road, Oldham OL2 7AU
| Today | See what it's worth now |
| 14 Nov 2025 | £205,000 |
| 13 Jun 2003 | £89,950 |
No other historical records.
36, Fraser Street, Oldham OL2 7SD
| Today | See what it's worth now |
| 14 Nov 2025 | £185,000 |
| 18 Aug 2017 | £120,000 |
114, Fraser Street, Oldham OL2 7SD
| Today | See what it's worth now |
| 7 Nov 2025 | £198,150 |
| 21 Jun 2019 | £45,000 |
No other historical records.
17, Moor Street, Oldham OL2 7BE
| Today | See what it's worth now |
| 5 Nov 2025 | £159,950 |
| 27 Jun 2013 | £72,000 |
33, Lyon Street, Oldham OL2 7RU
| Today | See what it's worth now |
| 3 Nov 2025 | £150,000 |
| 25 Sep 2007 | £90,000 |
86, Rochdale Road, Oldham OL2 7SA
| Today | See what it's worth now |
| 31 Oct 2025 | £150,000 |
| 15 Jul 2008 | £115,000 |
12, James Road, Oldham OL2 7TA
| Today | See what it's worth now |
| 24 Oct 2025 | £286,000 |
| 30 Jun 2021 | £255,000 |
27, Saint James Street, Oldham OL2 7TD
| Today | See what it's worth now |
| 24 Oct 2025 | £172,000 |
| 15 May 2015 | £102,500 |
42, Edward Road, Oldham OL2 7EY
| Today | See what it's worth now |
| 17 Oct 2025 | £356,000 |
| 23 May 2014 | £150,000 |
No other historical records.
26, Cheviots Road, Oldham OL2 7QS
| Today | See what it's worth now |
| 10 Oct 2025 | £268,000 |
| 15 Dec 2023 | £268,000 |
11, Alison Street, Oldham OL2 7SU
| Today | See what it's worth now |
| 9 Oct 2025 | £206,500 |
| 12 Oct 2018 | £137,000 |
4, Highlands Road, Oldham OL2 7RD

| Today | See what it's worth now |
| 9 Oct 2025 | £365,000 |
| 12 Feb 2021 | £184,000 |
107, Trent Road, Shaw OL2 7QH
| Today | See what it's worth now |
| 6 Oct 2025 | £210,000 |
No other historical records.
36, Lees Street, Oldham OL2 7TF
| Today | See what it's worth now |
| 23 Sep 2025 | £150,000 |
| 3 Apr 2007 | £99,950 |
3, Fern Common, Oldham OL2 7TH
| Today | See what it's worth now |
| 19 Sep 2025 | £220,000 |
| 25 Jan 2013 | £95,000 |
High Royd, Rochdale Road, Shaw OL2 7JA
| Today | See what it's worth now |
| 19 Sep 2025 | £680,000 |
No other historical records.
5, Park Cottages, Oldham OL2 7PQ


| Today | See what it's worth now |
| 19 Sep 2025 | £195,000 |
| 2 Dec 2016 | £122,500 |
13, Salts Street, Oldham OL2 7SY
| Today | See what it's worth now |
| 18 Sep 2025 | £165,000 |
| 18 Nov 2021 | £136,000 |
No other historical records.
Source Acknowledgement: © Crown copyright. England and Wales house price data is publicly available information produced by the HM Land Registry.This material was last updated on 4 February 2026. It covers the period from 1 January 1995 to 24 December 2025 and contains property transactions which have been registered during that period. Contains HM Land Registry data © Crown copyright and database right 2026. This data is licensed under the Open Government Licence v3.0.
Disclaimer: Rightmove.co.uk provides this HM Land Registry data "as is". The burden for fitness of the data relies completely with the user and is provided for informational purposes only. No warranty, express or implied, is given relating to the accuracy of content of the HM Land Registry data and Rightmove does not accept any liability for error or omission. If you have found an error with the data or need further information please contact HM Land Registry.
Permitted Use: Viewers of this Information are granted permission to access this Crown copyright material and to download it onto electronic, magnetic, optical or similar storage media provided that such activities are for private research, study or in-house use only. Any other use of the material requires the formal written permission of Land Registry which can be requested from us, and is subject to an additional licence and associated charge.
Map data ©OpenStreetMap contributors.
Rightmove takes no liability for your use of, or reliance on, Rightmove's Instant Valuation due to the limitations of our tracking tool listed here. Use of this tool is taken entirely at your own risk. All rights reserved.