
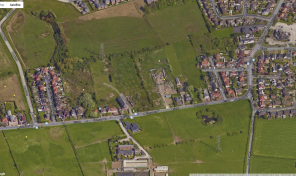
House Prices in Normoss
House prices in Normoss have an overall average of £188,561 over the last year.
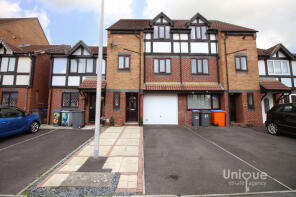
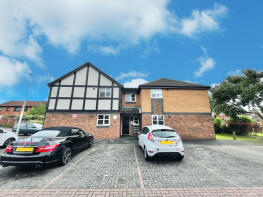
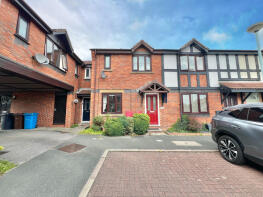
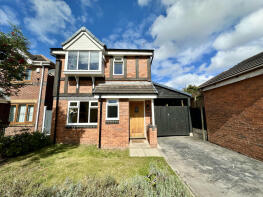
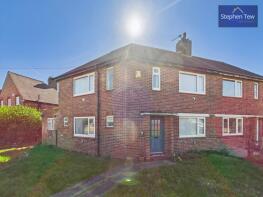
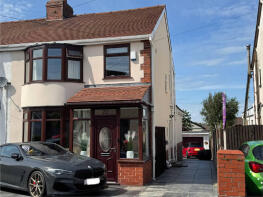
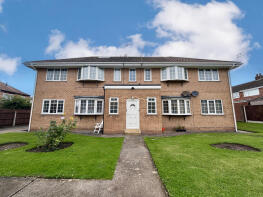
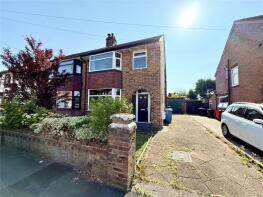
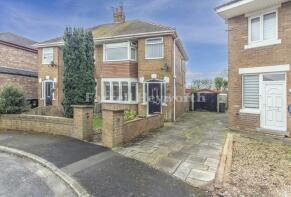
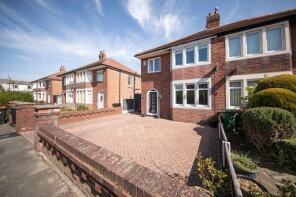
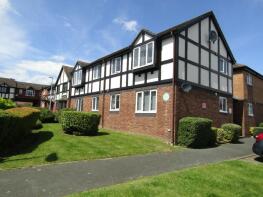
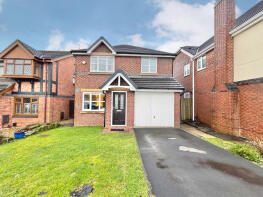
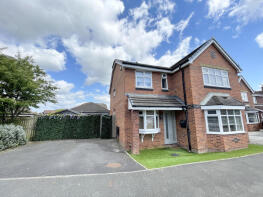
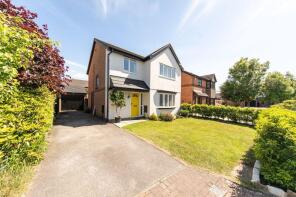
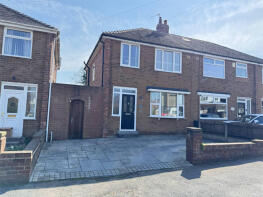
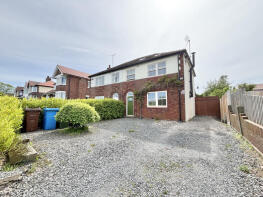
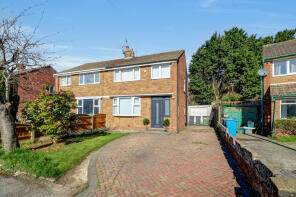
The majority of properties sold in Normoss during the last year were semi-detached properties, selling for an average price of £178,136. Detached properties sold for an average of £318,200, with terraced properties fetching £158,500.
Overall, the historical sold prices in Normoss over the last year were 5% up on the previous year and similar to the 2023 peak of £189,940.
Properties Sold
27, Bideford Avenue, Blackpool FY3 8PU
| Today | See what it's worth now |
| 24 Apr 2026 | £147,000 |
| 20 Jul 2020 | £127,000 |
No other historical records.
30, Avenue Road, Blackpool FY3 7SG

| Today | See what it's worth now |
| 1 Apr 2026 | £136,500 |
| 2 Oct 2009 | £115,000 |
5, Ledbury Road, Blackpool FY3 7SR
| Today | See what it's worth now |
| 31 Mar 2026 | £139,000 |
| 15 Nov 2011 | £110,000 |
1, Wensleydale Avenue, Blackpool FY3 7RS
| Today | See what it's worth now |
| 31 Mar 2026 | £128,000 |
| 31 Mar 2026 | £128,000 |
26, Conway Avenue, Blackpool FY3 7SF
| Today | See what it's worth now |
| 20 Mar 2026 | £165,000 |
| 17 Aug 2012 | £90,000 |
No other historical records.
21, Sandpiper Close, Blackpool FY3 8FJ
| Today | See what it's worth now |
| 13 Mar 2026 | £185,000 |
| 22 Oct 1999 | £81,950 |
No other historical records.
63, Greenfinch Court, Blackpool FY3 8FG
| Today | See what it's worth now |
| 27 Feb 2026 | £70,000 |
| 6 Mar 1997 | £42,000 |
No other historical records.
6, Shaftsbury Avenue, Blackpool FY3 8QS
| Today | See what it's worth now |
| 13 Feb 2026 | £128,000 |
| 27 Jul 2006 | £121,500 |
58, Plovers Way, Blackpool FY3 8FE
| Today | See what it's worth now |
| 16 Jan 2026 | £226,000 |
| 11 Dec 2020 | £200,000 |
2, Dinmore Avenue, Blackpool FY3 7RW
| Today | See what it's worth now |
| 16 Jan 2026 | £117,000 |
| 19 Feb 2003 | £31,000 |
No other historical records.
22, Westfield Avenue, Blackpool FY3 8QB
| Today | See what it's worth now |
| 18 Dec 2025 | £255,000 |
| 31 Aug 2001 | £77,500 |
5, Bowood Court, Blackpool FY3 7SD
| Today | See what it's worth now |
| 15 Dec 2025 | £90,000 |
| 19 Jul 2006 | £79,000 |
No other historical records.
27, Avenue Road, Blackpool FY3 7SG
| Today | See what it's worth now |
| 10 Dec 2025 | £194,000 |
| 21 Dec 2022 | £190,000 |
28, Southfield Drive, Blackpool FY3 0AN
| Today | See what it's worth now |
| 4 Dec 2025 | £147,500 |
| 23 Oct 2000 | £64,000 |
No other historical records.
The Meltons, Normoss Road, Blackpool FY3 0AL
| Today | See what it's worth now |
| 26 Nov 2025 | £380,000 |
| 1 Sep 2010 | £225,000 |
3, The Chase, Normoss Road, Blackpool FY3 0BF
| Today | See what it's worth now |
| 14 Nov 2025 | £260,000 |
| 9 Jul 2021 | £172,500 |
77, Ledbury Road, Normoss FY3 7SR

| Today | See what it's worth now |
| 31 Oct 2025 | £193,000 |
No other historical records.
11, Moresby Avenue, Blackpool FY3 7ST
| Today | See what it's worth now |
| 30 Oct 2025 | £197,000 |
| 17 Mar 2005 | £99,500 |
No other historical records.
39, Greenfinch Court, Blackpool FY3 8FG
| Today | See what it's worth now |
| 24 Oct 2025 | £77,000 |
| 28 Mar 2024 | £75,000 |
54, Plovers Way, Blackpool FY3 8FE
| Today | See what it's worth now |
| 23 Oct 2025 | £285,000 |
| 20 May 2005 | £210,000 |
7, Plovers Way, Blackpool FY3 8FD
| Today | See what it's worth now |
| 10 Oct 2025 | £360,000 |
| 19 Mar 2021 | £277,000 |
4, Bittern Close, Blackpool FY3 8FS
| Today | See what it's worth now |
| 12 Sep 2025 | £340,000 |
| 22 Oct 2004 | £216,000 |
23, Ravenswood Avenue, Blackpool FY3 7SU
| Today | See what it's worth now |
| 5 Sep 2025 | £210,000 |
| 28 Aug 2020 | £166,777 |
Source Acknowledgement: © Crown copyright. England and Wales house price data is publicly available information produced by the HM Land Registry.This material was last updated on 9 July 2026. It covers the period from 1 January 1995 to 30 April 2026 and contains property transactions which have been registered during that period. Contains HM Land Registry data © Crown copyright and database right 2026. This data is licensed under the Open Government Licence v3.0.
Disclaimer: Rightmove.co.uk provides this HM Land Registry data "as is". The burden for fitness of the data relies completely with the user and is provided for informational purposes only. No warranty, express or implied, is given relating to the accuracy of content of the HM Land Registry data and Rightmove does not accept any liability for error or omission. If you have found an error with the data or need further information please contact HM Land Registry.
Permitted Use: Viewers of this Information are granted permission to access this Crown copyright material and to download it onto electronic, magnetic, optical or similar storage media provided that such activities are for private research, study or in-house use only. Any other use of the material requires the formal written permission of Land Registry which can be requested from us, and is subject to an additional licence and associated charge.
Rightmove takes no liability for your use of, or reliance on, Rightmove's Instant Valuation due to the limitations of our tracking tool listed here. Use of this tool is taken entirely at your own risk. All rights reserved.