
House Prices in North Hayling
House prices in North Hayling have an overall average of £413,759 over the last year.
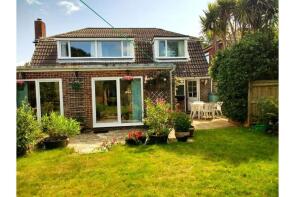
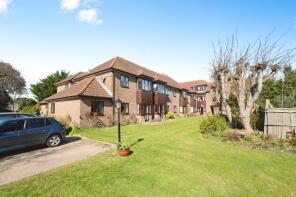
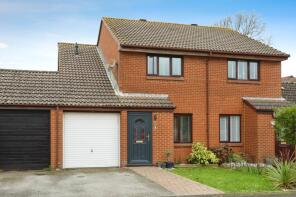
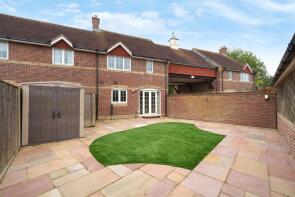
The majority of properties sold in North Hayling during the last year were detached properties, selling for an average price of £525,538. Flats sold for an average of £134,321, with semi-detached properties fetching £351,083.
Overall, the historical sold prices in North Hayling over the last year were 6% up on the previous year and 1% down on the 2022 peak of £418,262.
Properties Sold
Flat 10, Maple Court, Staunton Avenue, Hayling Island PO11 0EF
| Today | See what it's worth now |
| 20 Mar 2026 | £115,000 |
| 19 Mar 2024 | £105,000 |
6, Lime Grove, Hayling Island PO11 0HS
| Today | See what it's worth now |
| 5 Mar 2026 | £1,050,000 |
| 6 Mar 2020 | £560,000 |
17, Sinah Lane, Hayling Island PO11 0EY
| Today | See what it's worth now |
| 5 Mar 2026 | £530,000 |
No other historical records.
22, Fathoms Reach, Hayling Island PO11 0RA
| Today | See what it's worth now |
| 2 Mar 2026 | £240,000 |
| 2 Nov 2017 | £215,000 |
42, Kings Road, Hayling Island PO11 0PD
| Today | See what it's worth now |
| 20 Feb 2026 | £300,000 |
| 27 Jun 2005 | £170,000 |
2 Myrtle Villa, Manor Road, Hayling Island PO11 0QX
| Today | See what it's worth now |
| 20 Feb 2026 | £378,000 |
| 10 Jan 2020 | £300,000 |
No other historical records.
94, Havant Road, Hayling Island PO11 0LJ

| Today | See what it's worth now |
| 20 Feb 2026 | £528,000 |
| 17 Apr 2019 | £325,000 |
No other historical records.
Flat 55, Willow Tree, Mark Anthony Court, Hayling Island PO11 0AE
| Today | See what it's worth now |
| 13 Feb 2026 | £170,000 |
| 23 Jan 2019 | £175,000 |
8, Station Court, West Lane, Hayling Island PO11 0FP
| Today | See what it's worth now |
| 13 Feb 2026 | £150,000 |
| 1 Mar 2021 | £155,000 |
No other historical records.
9, Station Court, West Lane, Hayling Island PO11 0FP
| Today | See what it's worth now |
| 10 Feb 2026 | £165,000 |
| 20 Aug 2021 | £175,000 |
No other historical records.
4, Green Lane, Hayling Island PO11 0BG
| Today | See what it's worth now |
| 6 Feb 2026 | £520,000 |
| 26 Feb 2021 | £422,500 |
3, Bathurst Close, Hayling Island PO11 0UA
| Today | See what it's worth now |
| 6 Feb 2026 | £650,000 |
| 25 Jun 2004 | £369,000 |
15, Terriers Lane, Hayling Island PO11 0FF
| Today | See what it's worth now |
| 30 Jan 2026 | £380,000 |
| 30 Jun 2021 | £370,000 |
8, Hamfield Drive, Hayling Island PO11 0DB
| Today | See what it's worth now |
| 16 Jan 2026 | £530,000 |
| 27 Nov 2003 | £299,995 |
9, Lexden Gardens, Hayling Island PO11 0QP
| Today | See what it's worth now |
| 8 Jan 2026 | £400,000 |
| 14 Nov 2006 | £272,500 |
No other historical records.
35, Sinah Lane, Hayling Island PO11 0HH
| Today | See what it's worth now |
| 8 Jan 2026 | £450,000 |
| 24 Mar 2000 | £50,000 |
26, Sinah Lane, Hayling Island PO11 0HH
| Today | See what it's worth now |
| 7 Jan 2026 | £850,000 |
| 12 Jan 2021 | £750,000 |
3, St Helens Road, Hayling Island PO11 0BT
| Today | See what it's worth now |
| 7 Jan 2026 | £665,000 |
No other historical records.
14, Fernhurst Close, Hayling Island PO11 0DT
| Today | See what it's worth now |
| 19 Dec 2025 | £470,000 |
| 30 Aug 2007 | £345,000 |
No other historical records.
Flat 21, Maple Court, Staunton Avenue, Hayling Island PO11 0EF
| Today | See what it's worth now |
| 19 Dec 2025 | £73,000 |
| 29 Mar 2010 | £67,500 |
No other historical records.
40, Fathoms Reach, Hayling Island PO11 0RR
| Today | See what it's worth now |
| 19 Dec 2025 | £315,000 |
| 14 Sep 2017 | £240,000 |
2, 65 Fountain Square, Station Road, Hayling Island PO11 0FB
| Today | See what it's worth now |
| 18 Dec 2025 | £330,000 |
| 15 Oct 2003 | £215,000 |
No other historical records.
35, Beach Road, Hayling Island PO11 0JB
| Today | See what it's worth now |
| 18 Dec 2025 | £607,000 |
| 22 May 2009 | £341,000 |
No other historical records.
Source Acknowledgement: © Crown copyright. England and Wales house price data is publicly available information produced by the HM Land Registry.This material was last updated on 15 May 2026. It covers the period from 1 January 1995 to 31 March 2026 and contains property transactions which have been registered during that period. Contains HM Land Registry data © Crown copyright and database right 2026. This data is licensed under the Open Government Licence v3.0.
Disclaimer: Rightmove.co.uk provides this HM Land Registry data "as is". The burden for fitness of the data relies completely with the user and is provided for informational purposes only. No warranty, express or implied, is given relating to the accuracy of content of the HM Land Registry data and Rightmove does not accept any liability for error or omission. If you have found an error with the data or need further information please contact HM Land Registry.
Permitted Use: Viewers of this Information are granted permission to access this Crown copyright material and to download it onto electronic, magnetic, optical or similar storage media provided that such activities are for private research, study or in-house use only. Any other use of the material requires the formal written permission of Land Registry which can be requested from us, and is subject to an additional licence and associated charge.
Rightmove takes no liability for your use of, or reliance on, Rightmove's Instant Valuation due to the limitations of our tracking tool listed here. Use of this tool is taken entirely at your own risk. All rights reserved.