
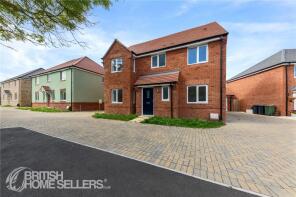
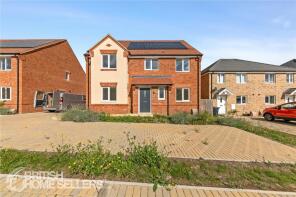
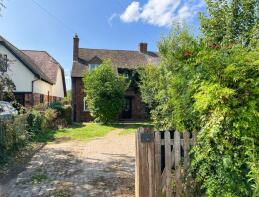
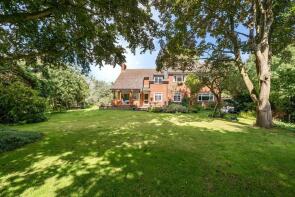
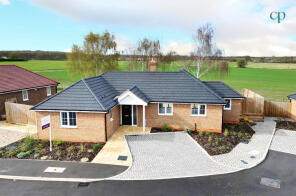
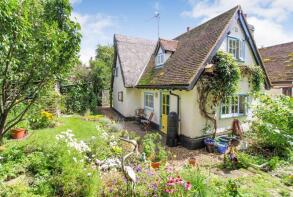
House Prices in Northill
House prices in Northill have an overall average of £785,000 over the last year.
The majority of properties sold in Northill during the last year were detached properties, selling for an average price of £875,000. Semi-detached properties sold for an average of £515,000.
Overall, the historical sold prices in Northill over the last year were 32% up on the previous year and 2% up on the 2021 peak of £773,231.
Properties Sold
21, Ickwell Road, Biggleswade SG18 9AB
| Today | See what it's worth now |
| 19 Mar 2026 | £675,000 |
| 25 Jul 2002 | £300,000 |
No other historical records.
Fasgadh, Sand Lane, Biggleswade SG18 9AE
| Today | See what it's worth now |
| 17 Dec 2025 | £450,000 |
| 1 Aug 2007 | £287,500 |
No other historical records.
49, Ickwell Road, Northill SG18 9AB

| Today | See what it's worth now |
| 26 Sep 2025 | £515,000 |
No other historical records.
16, Cookes Meadow, Northill SG18 9FX
| Today | See what it's worth now |
| 27 Aug 2025 | £1,500,000 |
No other historical records.
6, Garner Close, Northill SG18 9AF
| Today | See what it's worth now |
| 6 Jun 2025 | £462,500 |
No other historical records.
8, Ickwell Road, Biggleswade SG18 9AB
| Today | See what it's worth now |
| 7 May 2025 | £500,000 |
| 10 Oct 2014 | £375,000 |
6, Goodwin Field, Northill SG18 9GL
| Today | See what it's worth now |
| 25 Mar 2025 | £525,000 |
No other historical records.
School House, Bedford Road, Biggleswade SG18 9AH
| Today | See what it's worth now |
| 14 Mar 2025 | £615,000 |
| 3 May 2019 | £460,000 |
No other historical records.
4, Lychfield Close, Northill SG18 9GE
| Today | See what it's worth now |
| 7 Mar 2025 | £602,500 |
No other historical records.
23, Goodwin Field, Northill SG18 9GL
| Today | See what it's worth now |
| 28 Feb 2025 | £500,000 |
No other historical records.
14, Goodwin Field, Northill SG18 9GL
| Today | See what it's worth now |
| 28 Feb 2025 | £560,000 |
No other historical records.
14, Cookes Meadow, Northill SG18 9FX
| Today | See what it's worth now |
| 18 Feb 2025 | £1,475,000 |
No other historical records.
11, Ickwell Road, Biggleswade SG18 9AA

| Today | See what it's worth now |
| 18 Dec 2024 | £250,000 |
| 31 Jan 2008 | £124,999 |
8, Goodwin Field, Northill SG18 9GL
| Today | See what it's worth now |
| 25 Nov 2024 | £595,000 |
No other historical records.
28, Ickwell Road, Biggleswade SG18 9AB
| Today | See what it's worth now |
| 25 Oct 2024 | £335,000 |
| 30 Nov 1998 | £110,000 |
No other historical records.
Brookfield, Northill Road, Ickwell SG18 9ED

| Today | See what it's worth now |
| 18 Sep 2024 | £800,000 |
No other historical records.
21, Goodwin Field, Northill SG18 9GL
| Today | See what it's worth now |
| 19 Aug 2024 | £620,000 |
No other historical records.
Woodcote Corner, Bedford Road, Northill SG18 9AH
| Today | See what it's worth now |
| 7 Aug 2024 | £790,000 |
No other historical records.
3, Lychfield Close, Northill SG18 9GE
| Today | See what it's worth now |
| 25 Jul 2024 | £400,000 |
No other historical records.
43, Thorncote Road, Northill SG18 9AG

| Today | See what it's worth now |
| 14 Jun 2024 | £715,000 |
No other historical records.
7 Cow Hovel Road, Thorncote Road, Biggleswade SG18 9AQ
| Today | See what it's worth now |
| 10 Jun 2024 | £385,000 |
| 14 Jun 2021 | £330,000 |
No other historical records.
7, Lychfield Close, Northill SG18 9GE
| Today | See what it's worth now |
| 22 May 2024 | £610,000 |
No other historical records.
38, Ickwell Road, Biggleswade SG18 9AB
| Today | See what it's worth now |
| 2 May 2024 | £420,000 |
No other historical records.
Source Acknowledgement: © Crown copyright. England and Wales house price data is publicly available information produced by the HM Land Registry.This material was last updated on 9 July 2026. It covers the period from 1 January 1995 to 30 April 2026 and contains property transactions which have been registered during that period. Contains HM Land Registry data © Crown copyright and database right 2026. This data is licensed under the Open Government Licence v3.0.
Disclaimer: Rightmove.co.uk provides this HM Land Registry data "as is". The burden for fitness of the data relies completely with the user and is provided for informational purposes only. No warranty, express or implied, is given relating to the accuracy of content of the HM Land Registry data and Rightmove does not accept any liability for error or omission. If you have found an error with the data or need further information please contact HM Land Registry.
Permitted Use: Viewers of this Information are granted permission to access this Crown copyright material and to download it onto electronic, magnetic, optical or similar storage media provided that such activities are for private research, study or in-house use only. Any other use of the material requires the formal written permission of Land Registry which can be requested from us, and is subject to an additional licence and associated charge.
Rightmove takes no liability for your use of, or reliance on, Rightmove's Instant Valuation due to the limitations of our tracking tool listed here. Use of this tool is taken entirely at your own risk. All rights reserved.