
House Prices in Northney
House prices in Northney have an overall average of £418,306 over the last year.
The majority of properties sold in Northney during the last year were detached properties, selling for an average price of £571,098. Flats sold for an average of £155,445, with semi-detached properties fetching £356,842.
Overall, the historical sold prices in Northney over the last year were 8% up on the previous year and similar to the 2022 peak of £418,262.
Properties Sold
Acacia, Victoria Road, Hayling Island PO11 0LU
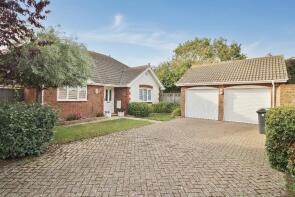
| Today | See today's value |
| 17 Aug 2026 | £470,000 |
| 19 Jun 1998 | £140,000 |
No other historical records.
7, North Shore Road, Hayling Island PO11 0HL
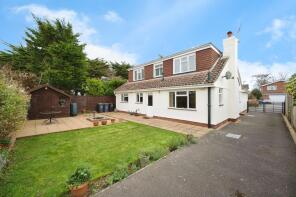
| Today | See today's value |
| 10 Aug 2026 | £583,000 |
| 8 Jan 2004 | £335,000 |
No other historical records.
210, Havant Road, Hayling Island PO11 0LN
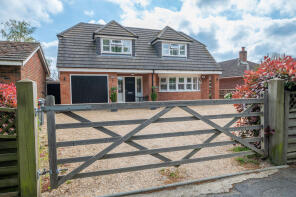
| Today | See today's value |
| 7 Aug 2026 | £675,000 |
| 16 Nov 2018 | £271,500 |
Flat 4, 16 Lynden Court, Gilbert Mead, Hayling Island PO11 0RF
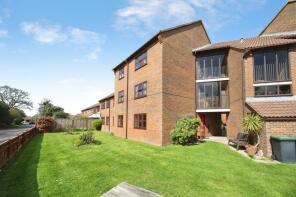
| Today | See today's value |
| 7 Aug 2026 | £175,000 |
| 1 Feb 2019 | £176,000 |
No other historical records.
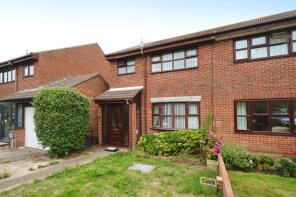
21, Saltmarsh Lane, Hayling Island PO11 0JT
| Today | See today's value |
| 23 Jul 2026 | £180,000 |
No other historical records.
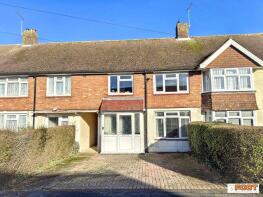
41, Kings Road, Hayling Island PO11 0PD
| Today | See today's value |
| 15 Jul 2026 | £290,000 |
| 6 Oct 2023 | £300,000 |
The Olives, Northwood Lane, Hayling Island PO11 0LR

| Today | See today's value |
| 10 Jul 2026 | £465,000 |
| 5 Aug 2011 | £340,000 |
94, Kings Road, Hayling Island PO11 0PE

| Today | See today's value |
| 10 Jul 2026 | £315,000 |
| 20 Feb 2020 | £220,000 |
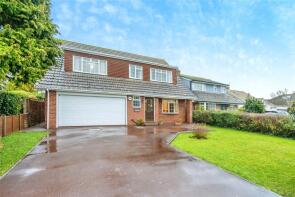
Rustlings, Queensway, Hayling Island PO11 0LY
| Today | See today's value |
| 8 Jul 2026 | £543,000 |
No other historical records.
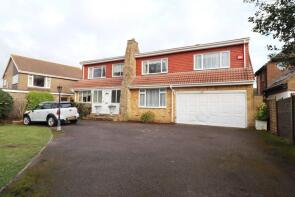
75, Sinah Lane, Hayling Island PO11 0HJ
| Today | See today's value |
| 7 Jul 2026 | £740,000 |
| 30 Jun 1997 | £152,500 |
No other historical records.
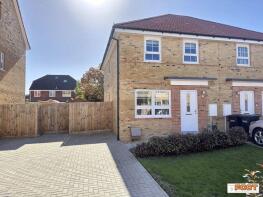
33, Sandeman Grove, Hayling Island PO11 0FT
| Today | See today's value |
| 7 Jul 2026 | £352,000 |
| 1 Mar 2024 | £351,500 |
No other historical records.
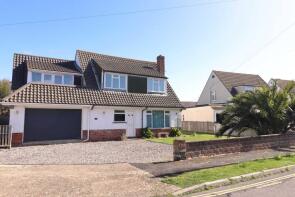
12, Magdala Road, Hayling Island PO11 0BH
| Today | See today's value |
| 7 Jul 2026 | £595,000 |
| 11 May 2012 | £265,000 |
No other historical records.
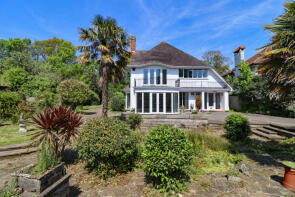
30, Bacon Lane, Hayling Island PO11 0DN
| Today | See today's value |
| 30 Jun 2026 | £845,000 |
No other historical records.
Flat 33, Maple Court, Staunton Avenue, Hayling Island PO11 0EF

| Today | See today's value |
| 30 Jun 2026 | £100,000 |
| 8 Nov 2018 | £78,000 |
Flat 20, 354, Sea Front, Hayling Island PO11 0BA

| Today | See today's value |
| 30 Jun 2026 | £115,000 |
| 6 Nov 2023 | £93,500 |
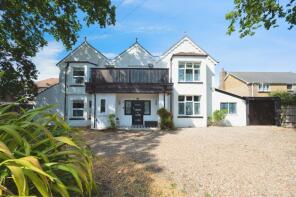
18 Bathurst Lodge, Bacon Lane, Hayling Island PO11 0DN
| Today | See today's value |
| 18 Jun 2026 | £570,000 |
| 30 Sep 2021 | £765,000 |
2, Southleigh Grove, Hayling Island PO11 0SH

| Today | See today's value |
| 10 Jun 2026 | £350,000 |
| 5 Dec 2024 | £235,000 |
2, Kingsway, Hayling Island PO11 0LZ

| Today | See today's value |
| 5 Jun 2026 | £685,000 |
| 12 Feb 2015 | £466,500 |
Flat 49, 354, Sea Front, Hayling Island PO11 0BA
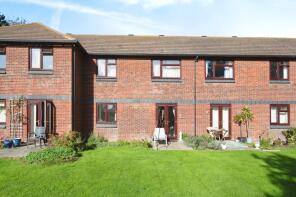
| Today | See today's value |
| 1 Jun 2026 | £112,500 |
| 31 May 2019 | £111,000 |
Flat 1, Norfolk Mews, Sea Front, Hayling Island PO11 0AP

| Today | See today's value |
| 26 May 2026 | £97,500 |
| 10 Mar 2023 | £75,000 |
Flat 3, 47, Sea Front, Hayling Island PO11 0AN
| Today | See today's value |
| 15 May 2026 | £61,000 |
| 5 Oct 2007 | £85,000 |
Flat 39, 11 Annes Court, Sea Front, Hayling Island PO11 0AJ
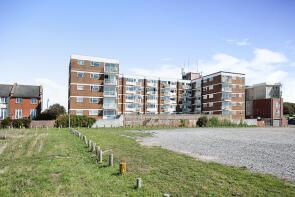
| Today | See today's value |
| 14 May 2026 | £180,000 |
| 12 Nov 2019 | £155,000 |
47, Kings Road, Hayling Island PO11 0PD
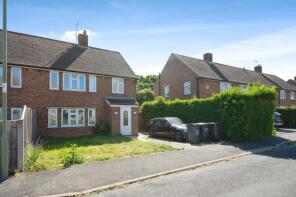
| Today | See today's value |
| 11 May 2026 | £340,000 |
| 21 Aug 2000 | £102,500 |
No other historical records.


Rightmove takes no liability for your use of, or reliance on, Rightmove's Instant Valuation due to the limitations of our tracking tool listed here. Use of this tool is taken entirely at your own risk. All rights reserved.