
House Prices in Northowram
House prices in Northowram have an overall average of £314,107 over the last year.
The majority of properties sold in Northowram during the last year were semi-detached properties, selling for an average price of £280,385. Terraced properties sold for an average of £178,115, with detached properties fetching £538,247.
Overall, the historical sold prices in Northowram over the last year were 20% up on the previous year and 8% up on the 2023 peak of £289,517.
Properties Sold
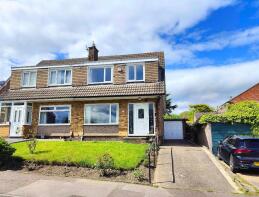
62, Windmill Drive, Northowram, Halifax HX3 7DF
| Today | See today's value |
| 31 Jul 2026 | £245,000 |
No other historical records.
12a, Westcroft Avenue, Shelf, Halifax HX3 7LE
| Today | See today's value |
| 30 Jul 2026 | £231,000 |
| 15 Sep 2021 | £168,000 |
No other historical records.
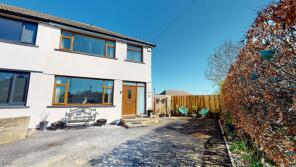
24, Daleson Close, Northowram, Halifax HX3 7JF
| Today | See today's value |
| 24 Jul 2026 | £275,000 |
| 13 Sep 2023 | £255,000 |
2, Hornbeam Grove, Northowram, Halifax HX3 7WL
| Today | See today's value |
| 24 Jul 2026 | £420,000 |
| 19 May 2017 | £300,000 |
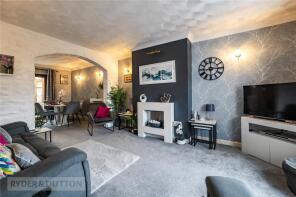
17, Stephen Close, Northowram, Halifax HX3 7BY
| Today | See today's value |
| 17 Jul 2026 | £225,000 |
| 31 Oct 1997 | £43,000 |
No other historical records.
6, Kell Lane, Halifax HX3 7AY

| Today | See today's value |
| 24 Jun 2026 | £250,000 |
| 18 May 1998 | £60,000 |
No other historical records.
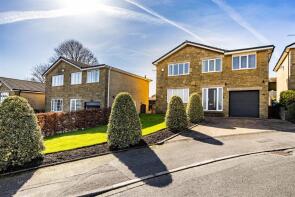
15, Chelsea Mansions, Northowram, Halifax HX3 7HG
| Today | See today's value |
| 23 Jun 2026 | £506,000 |
No other historical records.
29, Northowram Green, Northowram, Halifax HX3 7JE

| Today | See today's value |
| 19 Jun 2026 | £320,000 |
| 17 Mar 2023 | £291,500 |
11, Mulberry Way, Northowram, Halifax HX3 7WJ
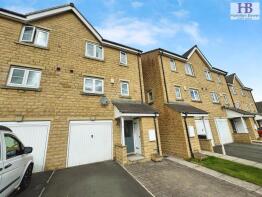
| Today | See today's value |
| 18 Jun 2026 | £277,000 |
| 13 Jul 2012 | £209,950 |
37, Back Clough, Northowram, Halifax HX3 7HH
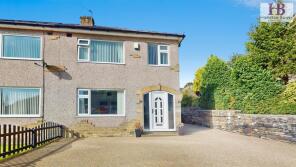
| Today | See today's value |
| 2 Jun 2026 | £252,000 |
| 31 Jul 2013 | £137,000 |
No other historical records.
2, Newlands Avenue, Northowram, Halifax HX3 7JB

| Today | See today's value |
| 29 May 2026 | £277,500 |
| 30 Nov 2006 | £158,000 |
No other historical records.
28, Marldon Road, Northowram, Halifax HX3 7BP

| Today | See today's value |
| 22 May 2026 | £293,000 |
| 24 Feb 2017 | £164,000 |
No other historical records.
7, Juniper Court, Northowram, Halifax HX3 7WE

| Today | See today's value |
| 22 May 2026 | £120,000 |
| 10 Nov 2023 | £92,000 |
7, Aspen Grove, Northowram, Halifax HX3 7WN

| Today | See today's value |
| 15 May 2026 | £498,000 |
| 3 Mar 2006 | £324,995 |
No other historical records.
6, Newlands Drive, Northowram, Halifax HX3 7JA
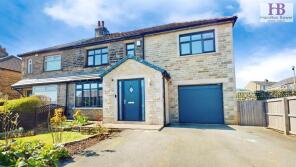
| Today | See today's value |
| 15 May 2026 | £355,000 |
| 19 Dec 2013 | £190,000 |
18, Heywood Court, Northowram, Halifax HX3 7BQ
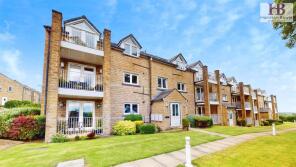
| Today | See today's value |
| 30 Apr 2026 | £227,000 |
| 3 Mar 2006 | £157,500 |
83, Kell Lane, Halifax HX3 7AY

| Today | See today's value |
| 17 Apr 2026 | £185,000 |
| 14 Aug 2019 | £99,500 |
16, Aspen Grove, Northowram, Halifax HX3 7WN

| Today | See today's value |
| 15 Apr 2026 | £527,000 |
| 29 Jun 2007 | £384,995 |
No other historical records.
Lister's View, Hough, Northowram, Halifax HX3 7AP

| Today | See today's value |
| 2 Apr 2026 | £560,000 |
No other historical records.
9, Park Grove, Bradford Road, Stump Cross, Halifax HX3 7AT
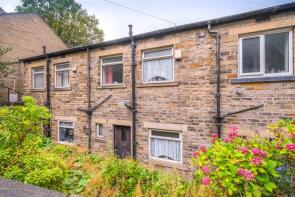
| Today | See today's value |
| 2 Apr 2026 | £85,000 |
No other historical records.
13, Upper Lane, Northowram, Halifax HX3 7EE

| Today | See today's value |
| 2 Apr 2026 | £218,000 |
| 13 Jan 2025 | £192,000 |
38, Daleson Close, Northowram, Halifax HX3 7JF
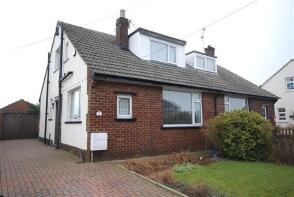
| Today | See today's value |
| 2 Apr 2026 | £335,000 |
| 21 Jul 2011 | £139,650 |
No other historical records.
7, Upper Hall View, Northowram, Halifax HX3 7ET

| Today | See today's value |
| 27 Mar 2026 | £445,000 |
| 29 Jun 1998 | £104,950 |
No other historical records.

Rightmove takes no liability for your use of, or reliance on, Rightmove's Instant Valuation due to the limitations of our tracking tool listed here. Use of this tool is taken entirely at your own risk. All rights reserved.