
House Prices in Northstowe
House prices in Northstowe have an overall average of £379,328 over the last year.
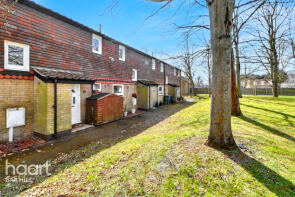
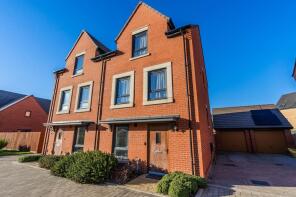
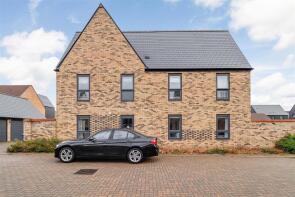
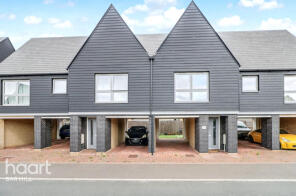
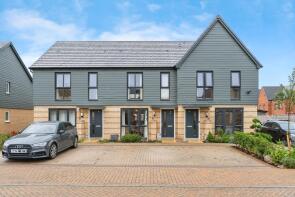
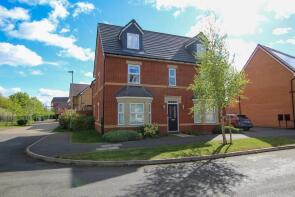
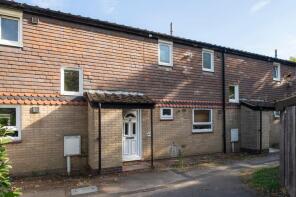
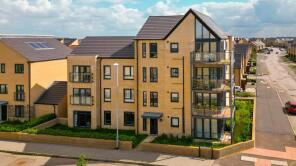
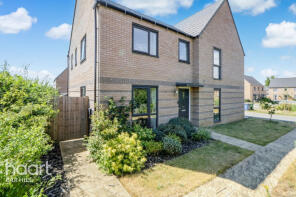
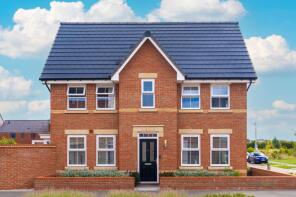
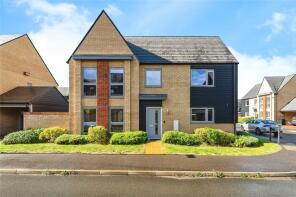
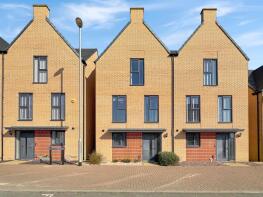
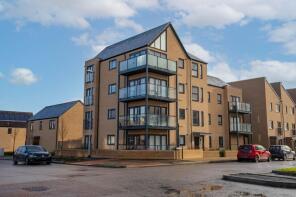
The majority of properties sold in Northstowe during the last year were detached properties, selling for an average price of £484,439. Semi-detached properties sold for an average of £343,650, with terraced properties fetching £284,600.
Overall, the historical sold prices in Northstowe over the last year were 2% up on the previous year and 12% down on the 2022 peak of £433,191.
Properties Sold
34, Rampton Drift, Cambridge CB24 3EW
| Today | See what it's worth now |
| 19 Mar 2026 | £295,000 |
| 1 Dec 2014 | £185,000 |
15, Burrows Way, Cambridge CB24 1AT
| Today | See what it's worth now |
| 6 Mar 2026 | £410,000 |
| 17 Dec 2019 | £375,000 |
No other historical records.
51, Britannia Road, Cambridge CB24 1DD
| Today | See what it's worth now |
| 6 Feb 2026 | £290,000 |
| 11 Dec 2020 | £249,995 |
No other historical records.
10, Hosel Road, Cambridge CB24 1AZ
| Today | See what it's worth now |
| 30 Jan 2026 | £268,000 |
| 28 Jun 2019 | £229,995 |
No other historical records.
6, Green Lane, Northstowe CB24 1EA
| Today | See what it's worth now |
| 30 Jan 2026 | £93,000 |
No other historical records.
64, Wellington Road, Cambridge CB24 1AX
| Today | See what it's worth now |
| 26 Jan 2026 | £230,000 |
| 25 Sep 2020 | £234,995 |
No other historical records.
34, Peppercorn Drive, Cambridge CB24 1BG
| Today | See what it's worth now |
| 7 Jan 2026 | £640,000 |
| 1 Aug 2019 | £574,995 |
No other historical records.
43, Rampton Drift, Cambridge CB24 3EW
| Today | See what it's worth now |
| 18 Dec 2025 | £275,000 |
| 12 Jul 2002 | £106,500 |
4, Woodpecker Close, Cambridge CB24 1AW
| Today | See what it's worth now |
| 18 Dec 2025 | £520,000 |
| 29 Jun 2018 | £484,995 |
No other historical records.
23, Heron Road, Cambridge CB24 1AS
| Today | See what it's worth now |
| 17 Dec 2025 | £535,000 |
| 13 Feb 2019 | £500,000 |
No other historical records.
3, Peppercorn Drive, Cambridge CB24 1BF
| Today | See what it's worth now |
| 12 Dec 2025 | £360,000 |
| 27 Nov 2020 | £337,995 |
No other historical records.
14, Peppercorn Drive, Cambridge CB24 1BG
| Today | See what it's worth now |
| 12 Dec 2025 | £345,000 |
| 21 Aug 2020 | £337,995 |
No other historical records.
4, Claudius Walk, Cambridge CB24 1BL
| Today | See what it's worth now |
| 12 Dec 2025 | £220,000 |
| 21 Dec 2018 | £234,995 |
No other historical records.
30, Grenadier Drive, Cambridge CB24 1AF

| Today | See what it's worth now |
| 5 Dec 2025 | £580,000 |
| 30 Apr 2018 | £529,995 |
No other historical records.
39, Mistle Thrush Drive, Cambridge CB24 1BS
| Today | See what it's worth now |
| 5 Dec 2025 | £189,000 |
No other historical records.
13, Wellington Road, Cambridge CB24 1AX
| Today | See what it's worth now |
| 19 Nov 2025 | £350,000 |
| 20 Nov 2020 | £331,059 |
No other historical records.
3, Shute Lane, Cambridge CB24 1BH
| Today | See what it's worth now |
| 12 Nov 2025 | £380,000 |
| 14 Aug 2020 | £362,995 |
No other historical records.
7, Hosel Road, Cambridge CB24 1AZ
| Today | See what it's worth now |
| 17 Oct 2025 | £421,052 |
| 19 Dec 2018 | £399,995 |
No other historical records.
14, Temple Road, Cambridge CB24 1BP
| Today | See what it's worth now |
| 26 Sep 2025 | £380,000 |
| 8 May 2019 | £350,000 |
No other historical records.
4, Fairway Close, Cambridge CB24 1ED
| Today | See what it's worth now |
| 23 Sep 2025 | £700,000 |
| 31 May 2022 | £739,995 |
No other historical records.
44, Stirling Road, Cambridge CB24 1BW
| Today | See what it's worth now |
| 5 Sep 2025 | £482,500 |
| 16 Sep 2019 | £429,995 |
No other historical records.
16, Wellington Road, Cambridge CB24 1AX

| Today | See what it's worth now |
| 27 Aug 2025 | £380,000 |
| 27 Aug 2025 | £380,000 |
91, Peppercorn Drive, Cambridge CB24 1BF
| Today | See what it's worth now |
| 22 Aug 2025 | £635,000 |
| 26 Apr 2019 | £539,995 |
No other historical records.
Source Acknowledgement: © Crown copyright. England and Wales house price data is publicly available information produced by the HM Land Registry.This material was last updated on 15 May 2026. It covers the period from 1 January 1995 to 31 March 2026 and contains property transactions which have been registered during that period. Contains HM Land Registry data © Crown copyright and database right 2026. This data is licensed under the Open Government Licence v3.0.
Disclaimer: Rightmove.co.uk provides this HM Land Registry data "as is". The burden for fitness of the data relies completely with the user and is provided for informational purposes only. No warranty, express or implied, is given relating to the accuracy of content of the HM Land Registry data and Rightmove does not accept any liability for error or omission. If you have found an error with the data or need further information please contact HM Land Registry.
Permitted Use: Viewers of this Information are granted permission to access this Crown copyright material and to download it onto electronic, magnetic, optical or similar storage media provided that such activities are for private research, study or in-house use only. Any other use of the material requires the formal written permission of Land Registry which can be requested from us, and is subject to an additional licence and associated charge.
Rightmove takes no liability for your use of, or reliance on, Rightmove's Instant Valuation due to the limitations of our tracking tool listed here. Use of this tool is taken entirely at your own risk. All rights reserved.