
House Prices in Nunny
House prices in Nunny have an overall average of £362,860 over the last year.
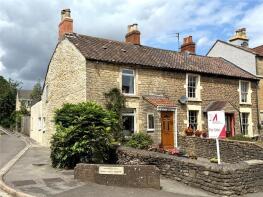
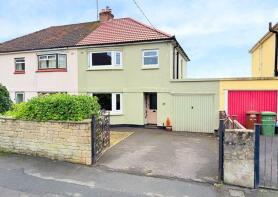
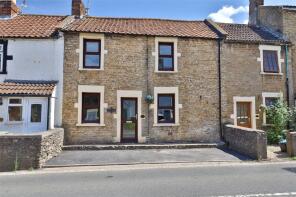
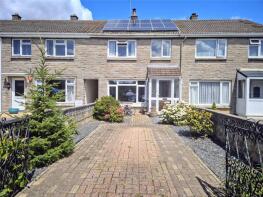
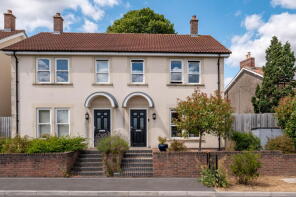
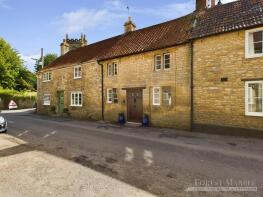
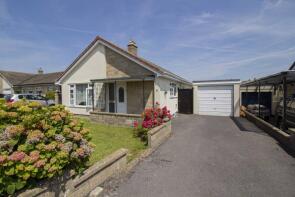
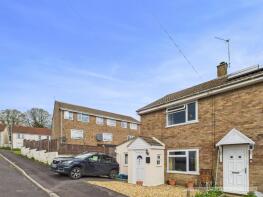
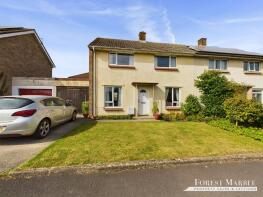
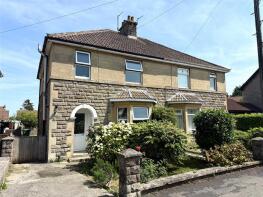
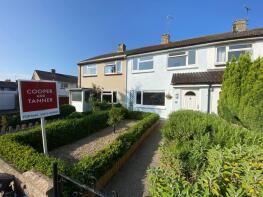
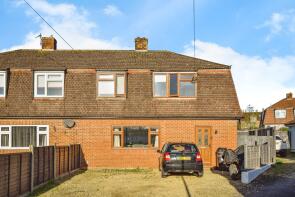
The majority of properties sold in Nunny during the last year were semi-detached properties, selling for an average price of £320,133. Terraced properties sold for an average of £340,857, with detached properties fetching £549,500.
Overall, the historical sold prices in Nunny over the last year were 7% down on the previous year and 14% down on the 2023 peak of £421,391.
Properties Sold
9a, Masons Way, Frome BA11 4QD
| Today | See what it's worth now |
| 16 Apr 2026 | £440,000 |
| 19 Jun 2003 | £125,500 |
No other historical records.
12, Cabell Road, Frome BA11 4BT
| Today | See what it's worth now |
| 23 Mar 2026 | £120,000 |
| 7 Oct 2015 | £95,000 |
No other historical records.
21, Cherry Grove, Frome BA11 4AW
| Today | See what it's worth now |
| 13 Mar 2026 | £120,000 |
No other historical records.
6, Upper Flowerfield, Glebelands, Nunney, Frome BA11 4NG
| Today | See what it's worth now |
| 6 Mar 2026 | £263,000 |
| 24 Nov 1999 | £53,950 |
1, Rossiters Hill, Frome BA11 4AL

| Today | See what it's worth now |
| 13 Feb 2026 | £530,000 |
| 1 Feb 2019 | £217,000 |
87, The Butts, Frome BA11 4AE
| Today | See what it's worth now |
| 9 Feb 2026 | £315,000 |
| 22 Dec 2011 | £112,000 |
66, The Butts, Frome BA11 4AA
| Today | See what it's worth now |
| 29 Jan 2026 | £269,500 |
| 26 Mar 1999 | £53,000 |
77, Whitewell Road, Frome BA11 4EN
| Today | See what it's worth now |
| 19 Jan 2026 | £415,000 |
| 22 Feb 2018 | £205,000 |
No other historical records.
15, Victoria Court, Whitewell Road, Frome BA11 4EL

| Today | See what it's worth now |
| 16 Jan 2026 | £240,000 |
| 8 Mar 2024 | £220,000 |
131, The Butts, Frome BA11 4AQ
| Today | See what it's worth now |
| 16 Jan 2026 | £337,500 |
No other historical records.
9, Cranmore View, Frome BA11 4DT
| Today | See what it's worth now |
| 6 Jan 2026 | £277,500 |
| 3 Jul 2020 | £200,000 |
No other historical records.
12, Cherry Grove, Frome BA11 4AW
| Today | See what it's worth now |
| 19 Dec 2025 | £130,000 |
| 16 Jun 2023 | £125,000 |
No other historical records.
38a, Stourton View, Frome BA11 4DZ
| Today | See what it's worth now |
| 19 Dec 2025 | £225,000 |
| 4 Sep 2015 | £160,000 |
50, Whitewell Road, Frome BA11 4EH
| Today | See what it's worth now |
| 12 Dec 2025 | £380,000 |
| 21 Jul 2017 | £242,500 |
No other historical records.
3, Church Street, Nunney, Frome BA11 4LW
| Today | See what it's worth now |
| 12 Dec 2025 | £210,000 |
| 28 Nov 2003 | £145,000 |
No other historical records.
6, Catherston Close, Frome BA11 4HR
| Today | See what it's worth now |
| 4 Dec 2025 | £330,000 |
| 29 Sep 2000 | £87,500 |
No other historical records.
58, Nunney Road, Frome BA11 4LF

| Today | See what it's worth now |
| 28 Nov 2025 | £364,000 |
| 9 Aug 2019 | £295,000 |
1, Richmond Road, Frome BA11 4EQ
| Today | See what it's worth now |
| 28 Nov 2025 | £265,500 |
| 26 Aug 2016 | £178,000 |
6, Oakfield Close, Frome BA11 4JL
| Today | See what it's worth now |
| 24 Nov 2025 | £290,000 |
No other historical records.
65, Lynfield Road, Frome BA11 4JB
| Today | See what it's worth now |
| 17 Nov 2025 | £377,500 |
No other historical records.
6, Stourton Gardens, Frome BA11 4EE
| Today | See what it's worth now |
| 14 Nov 2025 | £275,000 |
| 2 Aug 2016 | £195,000 |
10, Longleat Close, Frome BA11 4AZ
| Today | See what it's worth now |
| 6 Nov 2025 | £295,000 |
| 25 Jan 2018 | £215,000 |
18, Victoria Court, Whitewell Road, Frome BA11 4EL

| Today | See what it's worth now |
| 31 Oct 2025 | £159,000 |
| 23 Oct 2015 | £120,000 |
Source Acknowledgement: © Crown copyright. England and Wales house price data is publicly available information produced by the HM Land Registry.This material was last updated on 9 July 2026. It covers the period from 1 January 1995 to 30 April 2026 and contains property transactions which have been registered during that period. Contains HM Land Registry data © Crown copyright and database right 2026. This data is licensed under the Open Government Licence v3.0.
Disclaimer: Rightmove.co.uk provides this HM Land Registry data "as is". The burden for fitness of the data relies completely with the user and is provided for informational purposes only. No warranty, express or implied, is given relating to the accuracy of content of the HM Land Registry data and Rightmove does not accept any liability for error or omission. If you have found an error with the data or need further information please contact HM Land Registry.
Permitted Use: Viewers of this Information are granted permission to access this Crown copyright material and to download it onto electronic, magnetic, optical or similar storage media provided that such activities are for private research, study or in-house use only. Any other use of the material requires the formal written permission of Land Registry which can be requested from us, and is subject to an additional licence and associated charge.
Rightmove takes no liability for your use of, or reliance on, Rightmove's Instant Valuation due to the limitations of our tracking tool listed here. Use of this tool is taken entirely at your own risk. All rights reserved.