
House Prices in Old Catton
House prices in Old Catton have an overall average of £283,344 over the last year.
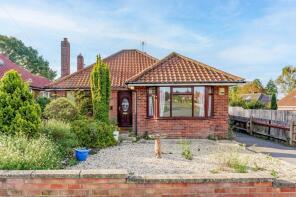
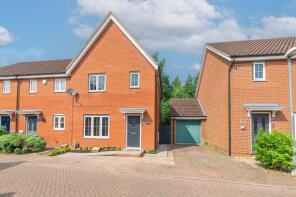
The majority of properties sold in Old Catton during the last year were detached properties, selling for an average price of £372,389. Terraced properties sold for an average of £235,879, with semi-detached properties fetching £255,646.
Overall, the historical sold prices in Old Catton over the last year were 3% down on the previous year and 7% down on the 2022 peak of £303,136.
Properties Sold
45, Oulton Road, Norwich NR6 6DE

| Today | See what it's worth now |
| 25 Mar 2026 | £77,772 |
| 11 Aug 2017 | £170,000 |
14, Lindley Close, Norwich NR6 7LL
| Today | See what it's worth now |
| 24 Mar 2026 | £220,000 |
| 11 Nov 2022 | £230,000 |
23, Evans Way, Norwich NR6 7LR
| Today | See what it's worth now |
| 19 Mar 2026 | £305,000 |
| 26 Sep 2003 | £132,500 |
16, Garrick Green, Norwich NR6 7AL
| Today | See what it's worth now |
| 18 Mar 2026 | £360,000 |
| 30 Jul 1999 | £78,000 |
165, Moore Avenue, Sprowston NR6 7LQ
| Today | See what it's worth now |
| 11 Mar 2026 | £250,000 |
No other historical records.
31, Whitethorn Close, Norwich NR6 6DT
| Today | See what it's worth now |
| 10 Mar 2026 | £149,000 |
| 25 Mar 2019 | £117,500 |
15, Taylors Lane, Norwich NR6 7BE
| Today | See what it's worth now |
| 10 Mar 2026 | £350,000 |
| 29 Jul 1997 | £82,000 |
No other historical records.
95, Moore Avenue, Sprowston NR6 7LG
| Today | See what it's worth now |
| 6 Mar 2026 | £200,000 |
No other historical records.
101, Lodge Lane, Norwich NR6 7HQ
| Today | See what it's worth now |
| 5 Mar 2026 | £600,000 |
| 16 Nov 2020 | £535,000 |
18, Brayfield Way, Norwich NR6 7ET
| Today | See what it's worth now |
| 2 Mar 2026 | £280,000 |
| 31 Mar 2000 | £67,000 |
No other historical records.
177, White Woman Lane, Norwich NR6 7JL
| Today | See what it's worth now |
| 20 Feb 2026 | £225,000 |
| 24 Nov 2016 | £180,000 |
126, Mountbatten Drive, Norwich NR6 7PP
| Today | See what it's worth now |
| 16 Feb 2026 | £310,000 |
| 25 Feb 2022 | £310,000 |
17, Whitworth Court, Norwich NR6 6GN
| Today | See what it's worth now |
| 16 Feb 2026 | £135,000 |
| 31 Oct 2014 | £104,000 |
21, Edgefield Close, Norwich NR6 7HP

| Today | See what it's worth now |
| 12 Feb 2026 | £240,000 |
| 11 Dec 2025 | £255,000 |
77, Spencer Road, Norwich NR6 6DG
| Today | See what it's worth now |
| 6 Feb 2026 | £230,000 |
| 29 May 2009 | £135,000 |
52, Edgefield Close, Norwich NR6 7HP
| Today | See what it's worth now |
| 6 Feb 2026 | £267,500 |
| 15 Aug 2014 | £177,500 |
130, Lodge Lane, Norwich NR6 7HJ
| Today | See what it's worth now |
| 30 Jan 2026 | £233,000 |
| 14 Sep 2023 | £215,000 |
18, Bryony Close, Norwich NR6 6JD
| Today | See what it's worth now |
| 30 Jan 2026 | £136,500 |
No other historical records.
52, The Warren, Norwich NR6 7NW

| Today | See what it's worth now |
| 30 Jan 2026 | £570,000 |
| 25 Oct 2013 | £250,000 |
No other historical records.
17, Southerwood, Norwich NR6 6JN
| Today | See what it's worth now |
| 30 Jan 2026 | £205,000 |
| 13 Nov 2015 | £138,500 |
17, Carterford Drive, Norwich NR3 4DW
| Today | See what it's worth now |
| 27 Jan 2026 | £300,000 |
| 30 Apr 2012 | £165,000 |
No other historical records.
32, Catton Chase, Old Catton NR6 7AS
| Today | See what it's worth now |
| 23 Jan 2026 | £295,000 |
No other historical records.
56, Mountbatten Drive, Norwich NR6 7PJ
| Today | See what it's worth now |
| 23 Jan 2026 | £248,000 |
| 25 Mar 2022 | £270,000 |
Source Acknowledgement: © Crown copyright. England and Wales house price data is publicly available information produced by the HM Land Registry.This material was last updated on 15 May 2026. It covers the period from 1 January 1995 to 31 March 2026 and contains property transactions which have been registered during that period. Contains HM Land Registry data © Crown copyright and database right 2026. This data is licensed under the Open Government Licence v3.0.
Disclaimer: Rightmove.co.uk provides this HM Land Registry data "as is". The burden for fitness of the data relies completely with the user and is provided for informational purposes only. No warranty, express or implied, is given relating to the accuracy of content of the HM Land Registry data and Rightmove does not accept any liability for error or omission. If you have found an error with the data or need further information please contact HM Land Registry.
Permitted Use: Viewers of this Information are granted permission to access this Crown copyright material and to download it onto electronic, magnetic, optical or similar storage media provided that such activities are for private research, study or in-house use only. Any other use of the material requires the formal written permission of Land Registry which can be requested from us, and is subject to an additional licence and associated charge.
Rightmove takes no liability for your use of, or reliance on, Rightmove's Instant Valuation due to the limitations of our tracking tool listed here. Use of this tool is taken entirely at your own risk. All rights reserved.