
House Prices in Old Leake
House prices in Old Leake have an overall average of £222,167 over the last year.
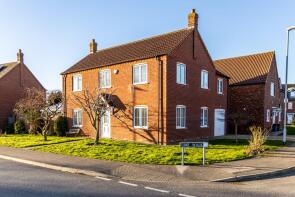
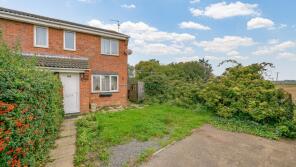
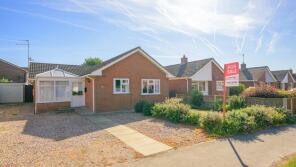
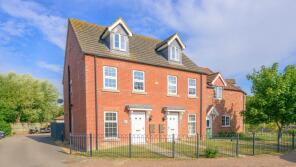
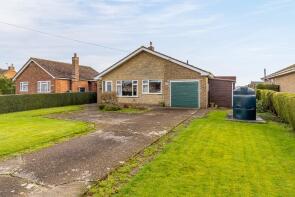
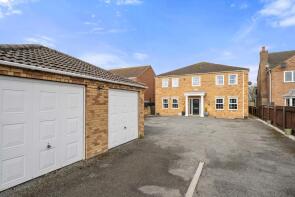
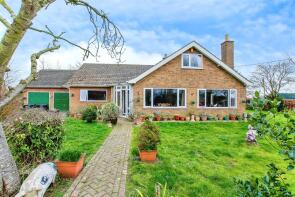
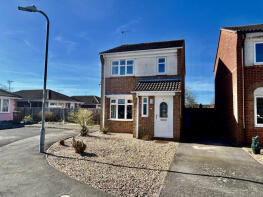
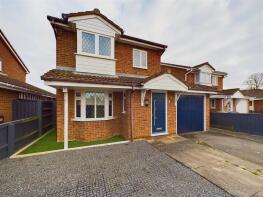
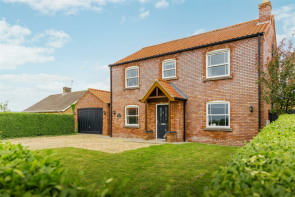
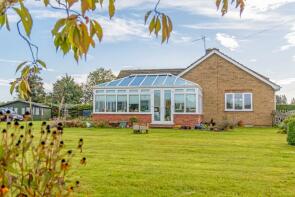
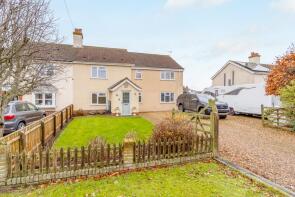
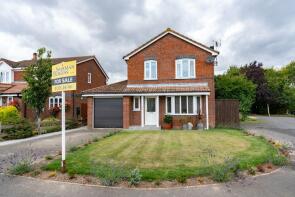
The majority of properties sold in Old Leake during the last year were detached properties, selling for an average price of £252,200. Semi-detached properties sold for an average of £150,619, with terraced properties fetching £178,000.
Overall, the historical sold prices in Old Leake over the last year were 13% down on the previous year and 9% down on the 2023 peak of £242,946.
Properties Sold
26, Chapel Road, Old Leake, Boston PE22 9PP
| Today | See what it's worth now |
| 4 Mar 2026 | £216,000 |
| 16 Jan 2009 | £135,500 |
13, Summerfields, Old Leake, Boston PE22 9HS
| Today | See what it's worth now |
| 27 Feb 2026 | £170,000 |
| 5 Mar 1998 | £45,500 |
No other historical records.
21, Hawthorn Road, Old Leake, Boston PE22 9NY
| Today | See what it's worth now |
| 20 Feb 2026 | £150,000 |
| 3 Jul 2015 | £93,000 |
No other historical records.
Ballacraine, Chapel Road, Old Leake, Boston PE22 9PP
| Today | See what it's worth now |
| 6 Feb 2026 | £242,500 |
| 25 Mar 2020 | £185,000 |
Shangri La, Meadow Way, Old Leake, Boston PE22 9JT

| Today | See what it's worth now |
| 6 Feb 2026 | £249,950 |
| 6 Nov 2017 | £167,000 |
Corner House, School Lane, Old Leake, Boston PE22 9NJ
| Today | See what it's worth now |
| 9 Jan 2026 | £277,500 |
| 17 Apr 2015 | £182,500 |
The Nook, Pode Lane, Old Leake, Boston PE22 9NF
| Today | See what it's worth now |
| 12 Dec 2025 | £148,000 |
| 27 Aug 2004 | £115,000 |
No other historical records.
The Mariners, Seadyke Road, Old Leake, Boston PE22 9HX
| Today | See what it's worth now |
| 12 Dec 2025 | £227,750 |
No other historical records.
42, St Marys Way, Old Leake, Boston PE22 9ND
| Today | See what it's worth now |
| 11 Dec 2025 | £127,475 |
| 1 Dec 2004 | £89,950 |
81, Church Road, Old Leake, Boston PE22 9NS
| Today | See what it's worth now |
| 27 Nov 2025 | £190,000 |
| 27 Nov 2006 | £138,000 |
6, Lime Walk, Old Leake, Boston PE22 9GB
| Today | See what it's worth now |
| 29 Oct 2025 | £178,000 |
| 14 May 2021 | £158,500 |
Gidea, Station Road, Old Leake, Boston PE22 9QQ
| Today | See what it's worth now |
| 17 Oct 2025 | £192,500 |
No other historical records.
Little Gracelands, Station Road, Commonside, Boston PE22 9PR
| Today | See what it's worth now |
| 3 Oct 2025 | £380,000 |
| 19 Mar 2021 | £347,000 |
Gride Farm, Midgate Lane East, Old Leake, Boston PE22 9SB
| Today | See what it's worth now |
| 2 Oct 2025 | £510,000 |
| 20 Jul 2005 | £355,000 |
13, Poplar Court, Old Leake, Boston PE22 9NL

| Today | See what it's worth now |
| 17 Sep 2025 | £140,000 |
| 24 Sep 2009 | £118,000 |
29, St Marys Way, Old Leake, Boston PE22 9ND
| Today | See what it's worth now |
| 22 Aug 2025 | £155,000 |
| 18 Oct 2024 | £165,000 |
3, Bert Allen Drive, Old Leake, Boston PE22 9LG
| Today | See what it's worth now |
| 30 Jun 2025 | £205,000 |
| 10 Apr 2013 | £140,000 |
6, Lychgate View, Old Leake, Boston PE22 9PL
| Today | See what it's worth now |
| 29 May 2025 | £87,500 |
| 22 Sep 2021 | £74,000 |
No other historical records.
Birchwood House, Sea Lane, Old Leake, Boston PE22 9JG
| Today | See what it's worth now |
| 29 May 2025 | £335,000 |
| 11 Sep 2015 | £211,000 |
Roberts, Sea Lane, Old Leake, Boston PE22 9JE
| Today | See what it's worth now |
| 13 May 2025 | £147,500 |
No other historical records.
Garalean, Sea Lane, Old Leake, Boston PE22 9JE
| Today | See what it's worth now |
| 28 Mar 2025 | £250,000 |
| 21 Jul 2009 | £138,500 |
No other historical records.
23, Church Road, Old Leake, Boston PE22 9LB
| Today | See what it's worth now |
| 28 Mar 2025 | £265,000 |
No other historical records.
At Last, Chapel Road, Old Leake, Boston PE22 9PP
| Today | See what it's worth now |
| 14 Mar 2025 | £425,000 |
| 27 Feb 2003 | £116,500 |
Source Acknowledgement: © Crown copyright. England and Wales house price data is publicly available information produced by the HM Land Registry.This material was last updated on 9 July 2026. It covers the period from 1 January 1995 to 30 April 2026 and contains property transactions which have been registered during that period. Contains HM Land Registry data © Crown copyright and database right 2026. This data is licensed under the Open Government Licence v3.0.
Disclaimer: Rightmove.co.uk provides this HM Land Registry data "as is". The burden for fitness of the data relies completely with the user and is provided for informational purposes only. No warranty, express or implied, is given relating to the accuracy of content of the HM Land Registry data and Rightmove does not accept any liability for error or omission. If you have found an error with the data or need further information please contact HM Land Registry.
Permitted Use: Viewers of this Information are granted permission to access this Crown copyright material and to download it onto electronic, magnetic, optical or similar storage media provided that such activities are for private research, study or in-house use only. Any other use of the material requires the formal written permission of Land Registry which can be requested from us, and is subject to an additional licence and associated charge.
Rightmove takes no liability for your use of, or reliance on, Rightmove's Instant Valuation due to the limitations of our tracking tool listed here. Use of this tool is taken entirely at your own risk. All rights reserved.