
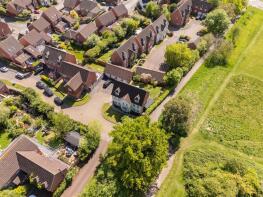
House Prices in Oldfield
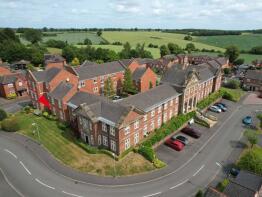
House prices in Oldfield have an overall average of £537,568 over the last year.
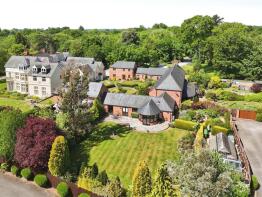
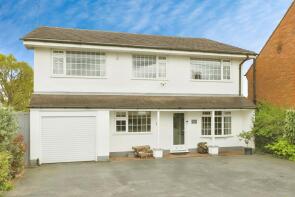
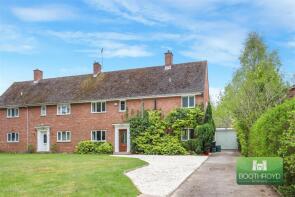
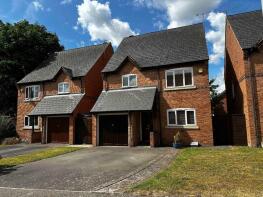
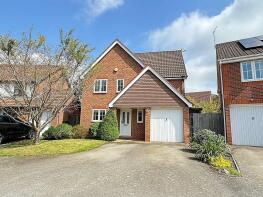
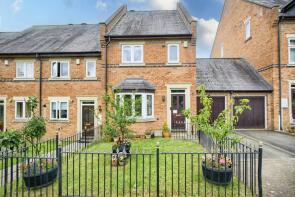
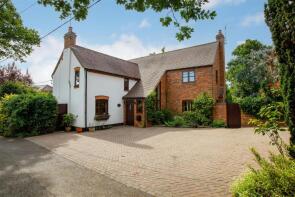
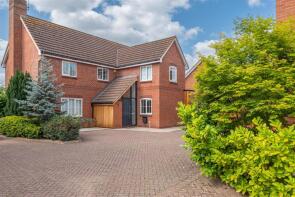
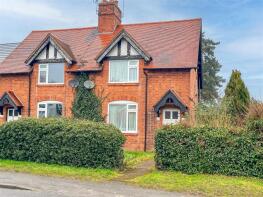
The majority of properties sold in Oldfield during the last year were detached properties, selling for an average price of £661,421. Semi-detached properties sold for an average of £484,286, with terraced properties fetching £419,667.
Overall, the historical sold prices in Oldfield over the last year were 12% up on the previous year and 5% down on the 2020 peak of £563,572.
Properties Sold
6, The Hayes, Warwick Road, Warwick CV35 7QU
| Today | See what it's worth now |
| 18 Dec 2025 | £390,000 |
| 25 Jan 2024 | £399,950 |
47, Highfield, Hatton Park, Warwick CV35 7TQ
| Today | See what it's worth now |
| 11 Dec 2025 | £410,000 |
| 14 Sep 2018 | £341,000 |
The Nuthurst, Shrewley Common, Shrewley CV35 7AN
| Today | See what it's worth now |
| 5 Dec 2025 | £490,000 |
| 30 Apr 1996 | £59,900 |
No other historical records.
Oak House, Stanley Drive, Kenilworth CV8 1LR
| Today | See what it's worth now |
| 28 Nov 2025 | £985,000 |
| 12 May 2021 | £999,995 |
No other historical records.
5, Haseley Court, Birmingham Road, Warwick CV35 7HG
| Today | See what it's worth now |
| 28 Nov 2025 | £690,000 |
| 24 Jan 2014 | £492,000 |
69 Field View House, Shrewley Common, Warwick CV35 7AN
| Today | See what it's worth now |
| 25 Nov 2025 | £650,000 |
| 14 Aug 2020 | £495,000 |
6, Woodcote Drive, Warwick CV35 7QA
| Today | See what it's worth now |
| 21 Nov 2025 | £625,000 |
| 12 Sep 2002 | £295,000 |
No other historical records.
Apartment 16, King Edwards Court, Blackwell Lane, Hatton Park, Hatton CV35 7ST
| Today | See what it's worth now |
| 14 Nov 2025 | £180,000 |
| 22 Oct 2021 | £174,000 |
6, Haseley Court, Birmingham Road, Warwick CV35 7HG
| Today | See what it's worth now |
| 14 Nov 2025 | £640,000 |
| 23 Mar 2017 | £550,000 |
2, Campden Grove, Hatton Park, Warwick CV35 7TY
| Today | See what it's worth now |
| 5 Nov 2025 | £570,000 |
| 26 Sep 2012 | £382,000 |
34, Lindsey Crescent, Kenilworth CV8 1FL

| Today | See what it's worth now |
| 31 Oct 2025 | £495,000 |
| 17 May 2021 | £375,000 |
No other historical records.
29, Quinton Close, Hatton Park, Warwick CV35 7TN
| Today | See what it's worth now |
| 29 Oct 2025 | £525,000 |
| 31 Mar 2005 | £319,950 |
Four Winds, Haseley Knob, Warwick CV35 7NJ
| Today | See what it's worth now |
| 17 Oct 2025 | £496,000 |
| 17 Oct 2025 | £496,000 |
11, Arlescote Close, Hatton Park, Warwick CV35 7TX
| Today | See what it's worth now |
| 6 Oct 2025 | £740,000 |
| 20 Dec 2002 | £374,950 |
No other historical records.
Clematis Cottage, Old Warwick Road, Warwick CV35 7AA
| Today | See what it's worth now |
| 2 Oct 2025 | £855,000 |
| 31 Jan 2002 | £370,000 |
7, Mollington Grove, Hatton Park, Warwick CV35 7TU
| Today | See what it's worth now |
| 24 Sep 2025 | £475,000 |
| 29 Jun 2000 | £165,450 |
No other historical records.
14, Tidmington Close, Hatton Park, Warwick CV35 7TE
| Today | See what it's worth now |
| 16 Sep 2025 | £490,000 |
| 30 Oct 1998 | £154,791 |
No other historical records.
11, Tredington Park, Hatton Park, Warwick CV35 7TT
| Today | See what it's worth now |
| 5 Sep 2025 | £372,000 |
| 31 May 2018 | £310,000 |
The Poplars, Croft Lane, Warwick CV35 7HL
| Today | See what it's worth now |
| 29 Aug 2025 | £805,000 |
| 12 Jan 2000 | £390,000 |
No other historical records.
3, Pebworth Drive, Hatton Park, Warwick CV35 7UD
| Today | See what it's worth now |
| 28 Aug 2025 | £850,000 |
| 5 May 2004 | £459,950 |
No other historical records.
25, Hill Wootton Road, Leek Wootton CV35 7QL
| Today | See what it's worth now |
| 15 Aug 2025 | £315,000 |
No other historical records.
11, The Hayes, Warwick Road, Warwick CV35 7QU
| Today | See what it's worth now |
| 5 Aug 2025 | £430,000 |
| 1 Feb 2008 | £299,000 |
No other historical records.
7, Crimscote Square, Hatton Park, Warwick CV35 7TS
| Today | See what it's worth now |
| 1 Aug 2025 | £281,000 |
| 27 Oct 2023 | £272,000 |
Stonefield, Church Lane, Warwick CV35 7QZ
| Today | See what it's worth now |
| 29 Jul 2025 | £965,000 |
| 16 Nov 2007 | £620,000 |
No other historical records.
Gaveston House, The Cedars, Warwick Road, Warwick CV35 7DS
| Today | See what it's worth now |
| 29 Jul 2025 | £1,030,000 |
| 23 Jun 2021 | £875,000 |
No other historical records.
Source Acknowledgement: © Crown copyright. England and Wales house price data is publicly available information produced by the HM Land Registry.This material was last updated on 4 February 2026. It covers the period from 1 January 1995 to 24 December 2025 and contains property transactions which have been registered during that period. Contains HM Land Registry data © Crown copyright and database right 2026. This data is licensed under the Open Government Licence v3.0.
Disclaimer: Rightmove.co.uk provides this HM Land Registry data "as is". The burden for fitness of the data relies completely with the user and is provided for informational purposes only. No warranty, express or implied, is given relating to the accuracy of content of the HM Land Registry data and Rightmove does not accept any liability for error or omission. If you have found an error with the data or need further information please contact HM Land Registry.
Permitted Use: Viewers of this Information are granted permission to access this Crown copyright material and to download it onto electronic, magnetic, optical or similar storage media provided that such activities are for private research, study or in-house use only. Any other use of the material requires the formal written permission of Land Registry which can be requested from us, and is subject to an additional licence and associated charge.
Map data ©OpenStreetMap contributors.
Rightmove takes no liability for your use of, or reliance on, Rightmove's Instant Valuation due to the limitations of our tracking tool listed here. Use of this tool is taken entirely at your own risk. All rights reserved.