
House Prices in Olveston
House prices in Olveston have an overall average of £468,317 over the last year.
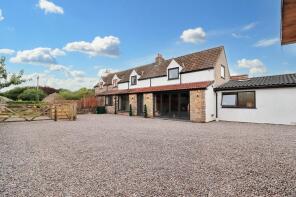
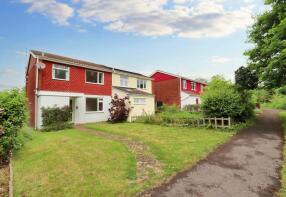
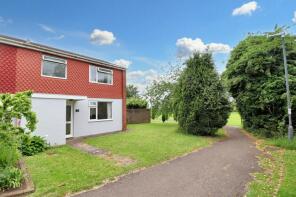
The majority of properties sold in Olveston during the last year were detached properties, selling for an average price of £554,975. Terraced properties sold for an average of £295,000.
Overall, the historical sold prices in Olveston over the last year were 4% down on the previous year and 21% down on the 2022 peak of £595,273.
Properties Sold
8, Laxton Close, Bristol BS35 4EB
| Today | See what it's worth now |
| 16 Oct 2025 | £295,000 |
| 25 Jun 2021 | £275,000 |
Rose Cottage, The Common, Olveston BS35 4DQ
| Today | See what it's worth now |
| 22 Aug 2025 | £710,000 |
No other historical records.
Hay Wain, The Green, Bristol BS35 4EJ
| Today | See what it's worth now |
| 22 Aug 2025 | £399,950 |
| 23 Aug 2006 | £195,000 |
3, Orchard Rise, Olveston BS35 4DY
| Today | See what it's worth now |
| 9 Jul 2025 | £410,000 |
No other historical records.
The Surgery, Haw Lane, Olveston BS35 4EG
| Today | See what it's worth now |
| 30 May 2025 | £280,000 |
No other historical records.
2, Gable Cottages, Elberton Road, Bristol BS35 4AB
| Today | See what it's worth now |
| 13 May 2025 | £670,000 |
| 12 Aug 2016 | £350,000 |
No other historical records.
Honeysuckle Cottage, New Road, Olveston BS35 4DX
| Today | See what it's worth now |
| 27 Mar 2025 | £615,000 |
No other historical records.
9, Bramley Close, Bristol BS35 4EA
| Today | See what it's worth now |
| 24 Mar 2025 | £360,000 |
| 16 Jun 2017 | £300,000 |
18, Orchard Rise, Bristol BS35 4DY
| Today | See what it's worth now |
| 24 Mar 2025 | £450,000 |
| 1 Sep 2022 | £475,000 |
Green Gates, The Street, Olveston BS35 4DA
| Today | See what it's worth now |
| 21 Mar 2025 | £580,000 |
No other historical records.
22, Orchard Rise, Bristol BS35 4DY

| Today | See what it's worth now |
| 13 Mar 2025 | £440,000 |
| 5 Jan 2017 | £395,000 |
7, Russet Close, Bristol BS35 4EE

| Today | See what it's worth now |
| 13 Mar 2025 | £270,000 |
| 2 Jun 2020 | £210,000 |
38, Russet Close, Olveston BS35 4EF
| Today | See what it's worth now |
| 21 Feb 2025 | £275,000 |
No other historical records.
45, Laxton Close, Bristol BS35 4ED
| Today | See what it's worth now |
| 6 Jan 2025 | £275,500 |
| 6 Nov 2015 | £210,000 |
2, Russet Close, Bristol BS35 4EE

| Today | See what it's worth now |
| 4 Dec 2024 | £282,500 |
| 25 Jul 2001 | £102,000 |
No other historical records.
Rose Lodge, New Road, Bristol BS35 4DX

| Today | See what it's worth now |
| 7 Nov 2024 | £550,000 |
| 9 Jun 2004 | £355,000 |
No other historical records.
4, Cromwell Court, Bristol BS35 4BW
| Today | See what it's worth now |
| 31 Oct 2024 | £772,500 |
| 20 Nov 2014 | £680,000 |
No other historical records.
6, Orchard Rise, Olveston BS35 4DY
| Today | See what it's worth now |
| 30 Oct 2024 | £597,000 |
No other historical records.
25, Russet Close, Bristol BS35 4EF
| Today | See what it's worth now |
| 25 Oct 2024 | £295,000 |
| 12 Apr 2010 | £178,000 |
Pear Tree House, The Common, Bristol BS35 4DQ
| Today | See what it's worth now |
| 10 Oct 2024 | £1,275,000 |
| 24 May 2006 | £455,000 |
Church Cottage, Church Hill, Bristol BS35 4BZ

| Today | See what it's worth now |
| 2 Sep 2024 | £485,000 |
| 30 Nov 2015 | £300,000 |
No other historical records.
Trevane, Musthay Fields, Tockington BS32 4NW
| Today | See what it's worth now |
| 30 Aug 2024 | £600,000 |
No other historical records.
1, Russet Close, Bristol BS35 4EE
| Today | See what it's worth now |
| 15 Jul 2024 | £295,000 |
| 10 Jun 2015 | £206,000 |
No other historical records.

Source Acknowledgement: © Crown copyright. England and Wales house price data is publicly available information produced by the HM Land Registry.This material was last updated on 9 July 2026. It covers the period from 1 January 1995 to 30 April 2026 and contains property transactions which have been registered during that period. Contains HM Land Registry data © Crown copyright and database right 2026. This data is licensed under the Open Government Licence v3.0.
Disclaimer: Rightmove.co.uk provides this HM Land Registry data "as is". The burden for fitness of the data relies completely with the user and is provided for informational purposes only. No warranty, express or implied, is given relating to the accuracy of content of the HM Land Registry data and Rightmove does not accept any liability for error or omission. If you have found an error with the data or need further information please contact HM Land Registry.
Permitted Use: Viewers of this Information are granted permission to access this Crown copyright material and to download it onto electronic, magnetic, optical or similar storage media provided that such activities are for private research, study or in-house use only. Any other use of the material requires the formal written permission of Land Registry which can be requested from us, and is subject to an additional licence and associated charge.
Rightmove takes no liability for your use of, or reliance on, Rightmove's Instant Valuation due to the limitations of our tracking tool listed here. Use of this tool is taken entirely at your own risk. All rights reserved.