
House Prices in Oxney
House prices in Oxney have an overall average of £510,099 over the last year.
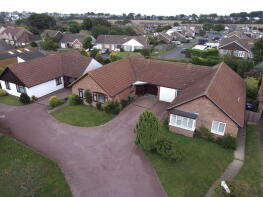
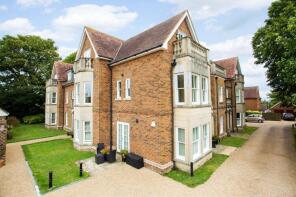
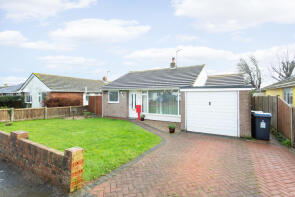
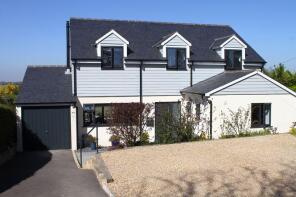
The majority of properties sold in Oxney during the last year were detached properties, selling for an average price of £633,218. Semi-detached properties sold for an average of £321,750, with flats fetching £411,250.
Overall, the historical sold prices in Oxney over the last year were 9% down on the previous year and 4% up on the 2023 peak of £490,842.
Properties Sold
Channel House, Sea View Road, St. Margarets Bay, St Margarets Bay CT15 6EE
| Today | See what it's worth now |
| 12 Mar 2026 | £760,000 |
No other historical records.
30 Rose Cottage, Kingsdown Road, Dover CT15 6AZ
| Today | See what it's worth now |
| 2 Mar 2026 | £290,000 |
| 20 May 1998 | £119,500 |
No other historical records.
Clifton Cottage, Station Road, Dover CT15 6ER
| Today | See what it's worth now |
| 25 Feb 2026 | £520,000 |
| 27 Nov 2003 | £296,000 |
Flat 3, The Old Vicarage, St Georges Place, Dover CT15 6GG
| Today | See what it's worth now |
| 17 Feb 2026 | £272,500 |
| 25 Jan 2022 | £300,000 |
6, Langdon Close, Dover CT15 6JP
| Today | See what it's worth now |
| 17 Dec 2025 | £400,000 |
| 15 Dec 2011 | £249,000 |
Flat 10, The Old Vicarage, St Georges Place, Dover CT15 6GG
| Today | See what it's worth now |
| 28 Nov 2025 | £550,000 |
| 16 Aug 2013 | £340,000 |
21, The Freedown, Dover CT15 6BD

| Today | See what it's worth now |
| 21 Oct 2025 | £378,000 |
| 11 Oct 2017 | £270,000 |
19, The Freedown, Dover CT15 6BD
| Today | See what it's worth now |
| 14 Oct 2025 | £305,000 |
| 19 Sep 2008 | £167,500 |
No other historical records.
77 Windy Ridge, The Droveway, Dover CT15 6DE
| Today | See what it's worth now |
| 3 Oct 2025 | £776,000 |
| 15 Jan 2021 | £500,000 |
No other historical records.
2, The Freedown, Dover CT15 6BD
| Today | See what it's worth now |
| 30 Sep 2025 | £225,000 |
| 19 Sep 1997 | £68,000 |
No other historical records.
Pinehurst, Salisbury Road, St. Margarets Bay, St Margarets Bay CT15 6DL
| Today | See what it's worth now |
| 26 Aug 2025 | £635,000 |
No other historical records.
51, Granville Road, Dover CT15 6DT
| Today | See what it's worth now |
| 15 Aug 2025 | £1,898,182 |
| 22 May 2009 | £825,000 |
No other historical records.
71, Kingsdown Road, Dover CT15 6BA
| Today | See what it's worth now |
| 1 Aug 2025 | £230,000 |
| 21 Dec 2015 | £152,500 |
No other historical records.
13, Droveway Gardens, Dover CT15 6BS
| Today | See what it's worth now |
| 26 Jun 2025 | £296,000 |
| 26 Jun 2025 | £296,000 |
29, Roman Way, Dover CT15 6AH
| Today | See what it's worth now |
| 13 Jun 2025 | £295,000 |
No other historical records.
Karis, Convent Close, Dover CT15 6JD

| Today | See what it's worth now |
| 15 May 2025 | £545,000 |
| 21 Nov 2007 | £320,000 |
No other historical records.
15, Kingsdown Road, St. Margarets-at-cliffe, St Margarets At Cliffe CT15 6AZ

| Today | See what it's worth now |
| 10 Apr 2025 | £764,000 |
No other historical records.
34 Sea Winds, Lighthouse Road, Dover CT15 6EJ
| Today | See what it's worth now |
| 7 Apr 2025 | £850,000 |
| 8 May 2019 | £770,000 |
63 Holburn Cottages, Kingsdown Road, Dover CT15 6BA

| Today | See what it's worth now |
| 3 Apr 2025 | £290,000 |
| 14 Dec 2005 | £175,000 |
48 Burley, Salisbury Road, Dover CT15 6DP

| Today | See what it's worth now |
| 1 Apr 2025 | £730,000 |
| 1 Nov 2016 | £749,500 |
No other historical records.
Flat 8, The Old Vicarage, St Georges Place, Dover CT15 6GG
| Today | See what it's worth now |
| 31 Mar 2025 | £258,500 |
| 11 Feb 2022 | £260,000 |
Montrose, Station Road, St. Margarets-at-cliffe, St Margarets At Cliffe CT15 6ER
| Today | See what it's worth now |
| 28 Mar 2025 | £435,000 |
No other historical records.
1 Conway, Sea View Road, Dover CT15 6EE
| Today | See what it's worth now |
| 4 Mar 2025 | £810,000 |
| 29 Nov 2013 | £540,000 |
Anchorage, Bay Hill, Dover CT15 6DU
| Today | See what it's worth now |
| 7 Feb 2025 | £1,025,000 |
| 24 Aug 2023 | £970,000 |
4, Townsend Farm Road, Dover CT15 6JJ
| Today | See what it's worth now |
| 24 Jan 2025 | £292,500 |
| 16 May 2003 | £166,000 |
No other historical records.
Source Acknowledgement: © Crown copyright. England and Wales house price data is publicly available information produced by the HM Land Registry.This material was last updated on 15 May 2026. It covers the period from 1 January 1995 to 31 March 2026 and contains property transactions which have been registered during that period. Contains HM Land Registry data © Crown copyright and database right 2026. This data is licensed under the Open Government Licence v3.0.
Disclaimer: Rightmove.co.uk provides this HM Land Registry data "as is". The burden for fitness of the data relies completely with the user and is provided for informational purposes only. No warranty, express or implied, is given relating to the accuracy of content of the HM Land Registry data and Rightmove does not accept any liability for error or omission. If you have found an error with the data or need further information please contact HM Land Registry.
Permitted Use: Viewers of this Information are granted permission to access this Crown copyright material and to download it onto electronic, magnetic, optical or similar storage media provided that such activities are for private research, study or in-house use only. Any other use of the material requires the formal written permission of Land Registry which can be requested from us, and is subject to an additional licence and associated charge.
Map data ©OpenStreetMap contributors.
Rightmove takes no liability for your use of, or reliance on, Rightmove's Instant Valuation due to the limitations of our tracking tool listed here. Use of this tool is taken entirely at your own risk. All rights reserved.