House Prices in Ripple
Properties Sold
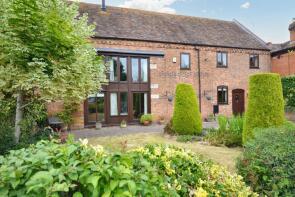
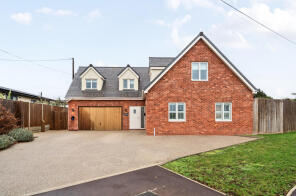
2, Manor Barn, Station Road, Ripple GL20 6EY
| Today | See what it's worth now |
| 21 May 2025 | £700,000 |
No other historical records.
1, School Lane, Ripple GL20 6EU
| Today | See what it's worth now |
| 31 Mar 2025 | £495,000 |
| 12 Aug 2004 | £203,000 |
The Granary, Station Road, Tewkesbury GL20 6EY

| Today | See what it's worth now |
| 25 Mar 2025 | £660,000 |
| 11 Aug 2017 | £470,000 |
Honeywell, School Lane, Ripple GL20 6EU
| Today | See what it's worth now |
| 18 Dec 2024 | £455,000 |
No other historical records.
4, The Cross, Ripple GL20 6EZ
| Today | See what it's worth now |
| 6 Dec 2024 | £185,000 |
| 4 Dec 2019 | £124,025 |
Shell Cottage, Stratford Bridge, Ripple, Tewkesbury GL20 6HE
| Today | See what it's worth now |
| 29 Nov 2024 | £653,000 |
No other historical records.
2, School Lane, Ripple GL20 6EU
| Today | See what it's worth now |
| 28 Jun 2024 | £585,000 |
| 8 Mar 2004 | £192,500 |
No other historical records.
Stratford Bridge Cottage, Stratford Bridge, Tewkesbury GL20 6HE

| Today | See what it's worth now |
| 22 Apr 2022 | £500,000 |
| 28 Apr 2017 | £225,000 |
No other historical records.
The Butts, School Lane, Tewkesbury GL20 6EU
| Today | See what it's worth now |
| 1 Mar 2022 | £472,500 |
| 24 Apr 1996 | £69,500 |
No other historical records.
April House, Station Road, Tewkesbury GL20 6EY

| Today | See what it's worth now |
| 3 Dec 2021 | £410,000 |
| 21 Sep 2018 | £365,000 |
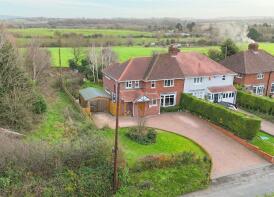
Gubberhill Farm, Brockeridge Common, Ripple, Tewkesbury GL20 6HB
| Today | See what it's worth now |
| 7 Sep 2021 | £1,100,000 |
No other historical records.
Stoneacre, School Lane, Tewkesbury GL20 6EU
| Today | See what it's worth now |
| 30 Jun 2021 | £477,000 |
No other historical records.
Ripplebrook House, The Cross, Tewkesbury GL20 6HA
| Today | See what it's worth now |
| 20 Nov 2020 | £1,100,000 |
| 4 May 2001 | £361,000 |
No other historical records.
Manor Cottage, The Cross, Tewkesbury GL20 6EZ

| Today | See what it's worth now |
| 19 Aug 2020 | £395,000 |
| 7 May 2009 | £370,000 |
1, Manor Barn, Station Road, Tewkesbury GL20 6EY

| Today | See what it's worth now |
| 25 Oct 2019 | £600,000 |
| 14 Dec 2018 | £640,000 |
Puck Cottage, Bow Lane, Tewkesbury GL20 6EW

| Today | See what it's worth now |
| 4 Oct 2019 | £375,000 |
| 10 May 2010 | £265,000 |
No other historical records.
The Old School, School Lane, Tewkesbury GL20 6EU

| Today | See what it's worth now |
| 4 Sep 2018 | £660,000 |
| 20 Jul 2015 | £435,000 |
Ripple Cottage, The Cross, Tewkesbury GL20 6EZ

| Today | See what it's worth now |
| 23 Nov 2017 | £450,000 |
No other historical records.
The Old Tythe Barn, School Lane, Tewkesbury GL20 6EU

| Today | See what it's worth now |
| 13 Oct 2017 | £597,500 |
| 23 Dec 2005 | £541,000 |
No other historical records.
Byewater, Rectory Lane, Tewkesbury GL20 6HQ
| Today | See what it's worth now |
| 29 Sep 2017 | £265,000 |
No other historical records.
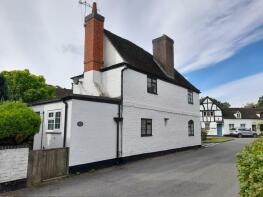
Church Cottage, The Cross, Tewkesbury GL20 6HA
| Today | See what it's worth now |
| 20 Sep 2017 | £380,000 |
| 4 Dec 2015 | £365,000 |
No other historical records.
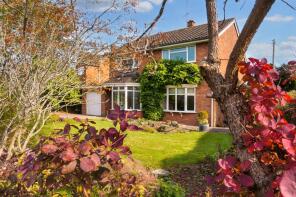
Oakleigh, The Cross, Tewkesbury GL20 6HA

| Today | See what it's worth now |
| 10 Mar 2017 | £373,305 |
| 4 Mar 2005 | £195,000 |
No other historical records.
4, Twittocks Cottages, A38 Brockeridge Roundabout To Cherry Orchard Lane, Twyning, Tewkesbury GL20 6HG

| Today | See what it's worth now |
| 13 Dec 2016 | £280,000 |
No other historical records.


Source Acknowledgement: © Crown copyright. England and Wales house price data is publicly available information produced by the HM Land Registry.This material was last updated on 9 July 2026. It covers the period from 1 January 1995 to 30 April 2026 and contains property transactions which have been registered during that period. Contains HM Land Registry data © Crown copyright and database right 2026. This data is licensed under the Open Government Licence v3.0.
Disclaimer: Rightmove.co.uk provides this HM Land Registry data "as is". The burden for fitness of the data relies completely with the user and is provided for informational purposes only. No warranty, express or implied, is given relating to the accuracy of content of the HM Land Registry data and Rightmove does not accept any liability for error or omission. If you have found an error with the data or need further information please contact HM Land Registry.
Permitted Use: Viewers of this Information are granted permission to access this Crown copyright material and to download it onto electronic, magnetic, optical or similar storage media provided that such activities are for private research, study or in-house use only. Any other use of the material requires the formal written permission of Land Registry which can be requested from us, and is subject to an additional licence and associated charge.
Rightmove takes no liability for your use of, or reliance on, Rightmove's Instant Valuation due to the limitations of our tracking tool listed here. Use of this tool is taken entirely at your own risk. All rights reserved.