
House Prices in PE21
House prices in PE21 have an overall average of £200,550 over the last year.
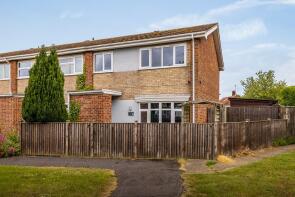
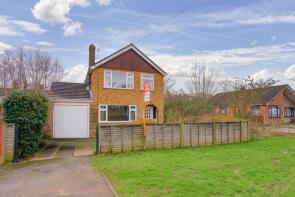
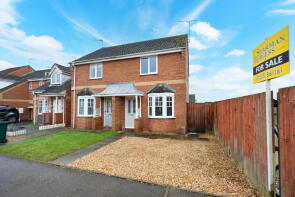
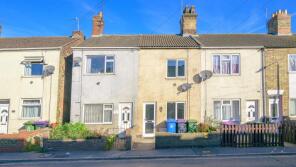
The majority of properties sold in PE21 during the last year were detached properties, selling for an average price of £267,615. Semi-detached properties sold for an average of £161,505, with terraced properties fetching £132,032.
Overall, the historical sold prices in PE21 over the last year were 2% down on the previous year and 2% up on the 2023 peak of £196,029.
Properties Sold
210, Sleaford Road, Boston PE21 7PG
| Today | See what it's worth now |
| 23 Apr 2026 | £299,950 |
| 29 Feb 2016 | £163,000 |
No other historical records.
42, Lindis Road, Fishtoft, Boston PE21 9RT
| Today | See what it's worth now |
| 23 Apr 2026 | £227,000 |
| 6 Jun 2022 | £225,000 |
44, Windsor Crescent, Boston PE21 0HY
| Today | See what it's worth now |
| 20 Apr 2026 | £148,000 |
| 23 May 2014 | £114,000 |
Extensions and planning permission in PE21
See planning approval stats, extension build costs and value added estimates.

30, Woodside, Boston PE21 7HE
| Today | See what it's worth now |
| 15 Apr 2026 | £160,000 |
| 13 Feb 2019 | £115,000 |
No other historical records.
9, Saundergate Park, Wyberton, Boston PE21 7BU

| Today | See what it's worth now |
| 10 Apr 2026 | £162,500 |
| 24 Mar 2016 | £128,000 |
77, Ward Crescent, Fishtoft, Boston PE21 0RQ
| Today | See what it's worth now |
| 2 Apr 2026 | £160,000 |
| 29 Jul 2021 | £137,500 |
Loreley, Bartol Crescent, Boston PE21 8HG
| Today | See what it's worth now |
| 2 Apr 2026 | £170,000 |
| 20 Jan 2006 | £102,000 |
No other historical records.
62, Smalley Road, Boston PE21 0NJ
| Today | See what it's worth now |
| 2 Apr 2026 | £137,000 |
| 2 Jul 2004 | £99,950 |
25, Broadfield Street, Boston PE21 8XA
| Today | See what it's worth now |
| 2 Apr 2026 | £88,000 |
| 27 Apr 2018 | £81,000 |
30, Medforth Lane, Boston PE21 9HW
| Today | See what it's worth now |
| 27 Mar 2026 | £142,000 |
| 27 Jan 2023 | £149,000 |
11, Ladds Close, Fishtoft, Boston PE21 0SP
| Today | See what it's worth now |
| 27 Mar 2026 | £150,000 |
| 8 May 2019 | £120,000 |
5, Huntsman Close, Fishtoft, Boston PE21 0BQ
| Today | See what it's worth now |
| 26 Mar 2026 | £215,000 |
| 2 Feb 1998 | £59,950 |
No other historical records.
26, Fieldfare Croft, Boston PE21 8ED
| Today | See what it's worth now |
| 24 Mar 2026 | £95,000 |
| 1 Oct 1999 | £30,500 |
No other historical records.
49, King Street, Boston PE21 8UU
| Today | See what it's worth now |
| 23 Mar 2026 | £125,000 |
| 17 Jan 1997 | £35,950 |
No other historical records.
59, Peck Avenue, Boston PE21 8DH
| Today | See what it's worth now |
| 20 Mar 2026 | £120,000 |
| 27 Feb 2009 | £112,500 |
No other historical records.
34, Sir Isaac Newton Drive, Boston PE21 7SG

| Today | See what it's worth now |
| 20 Mar 2026 | £168,500 |
| 6 Aug 2007 | £117,000 |
8, Bladon Estate, Fishtoft, Boston PE21 0QZ
| Today | See what it's worth now |
| 20 Mar 2026 | £96,500 |
| 6 Sep 2019 | £74,000 |
No other historical records.
200, Wyberton West Road, Boston PE21 7JU
| Today | See what it's worth now |
| 18 Mar 2026 | £175,000 |
| 10 Jul 2013 | £135,000 |
4, Redbourne Terrace, Haven Village, Boston PE21 8PX
| Today | See what it's worth now |
| 16 Mar 2026 | £167,000 |
| 31 Mar 2016 | £145,000 |
15, Saundergate Park, Wyberton, Boston PE21 7BU
| Today | See what it's worth now |
| 13 Mar 2026 | £202,500 |
| 13 Jun 2022 | £182,500 |
8, Brown's Road, Boston PE21 9BZ
| Today | See what it's worth now |
| 13 Mar 2026 | £100,000 |
| 15 Oct 2018 | £100,000 |
44, Deldale Road, Wyberton, Boston PE21 7BT
| Today | See what it's worth now |
| 12 Mar 2026 | £250,000 |
| 20 Oct 2016 | £155,000 |
61, Carlton Road, Boston PE21 8PA
| Today | See what it's worth now |
| 11 Mar 2026 | £165,000 |
| 22 Dec 2003 | £50,000 |
No other historical records.


Source Acknowledgement: © Crown copyright. England and Wales house price data is publicly available information produced by the HM Land Registry.This material was last updated on 9 July 2026. It covers the period from 1 January 1995 to 30 April 2026 and contains property transactions which have been registered during that period. Contains HM Land Registry data © Crown copyright and database right 2026. This data is licensed under the Open Government Licence v3.0.
Disclaimer: Rightmove.co.uk provides this HM Land Registry data "as is". The burden for fitness of the data relies completely with the user and is provided for informational purposes only. No warranty, express or implied, is given relating to the accuracy of content of the HM Land Registry data and Rightmove does not accept any liability for error or omission. If you have found an error with the data or need further information please contact HM Land Registry.
Permitted Use: Viewers of this Information are granted permission to access this Crown copyright material and to download it onto electronic, magnetic, optical or similar storage media provided that such activities are for private research, study or in-house use only. Any other use of the material requires the formal written permission of Land Registry which can be requested from us, and is subject to an additional licence and associated charge.
Rightmove takes no liability for your use of, or reliance on, Rightmove's Instant Valuation due to the limitations of our tracking tool listed here. Use of this tool is taken entirely at your own risk. All rights reserved.