
House Prices in Pendeford
House prices in Pendeford have an overall average of £201,539 over the last year.
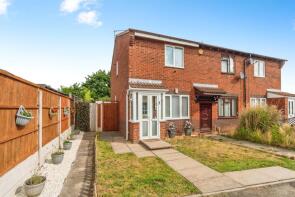
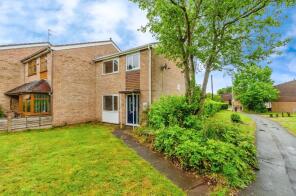
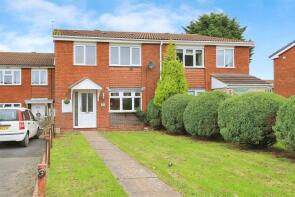
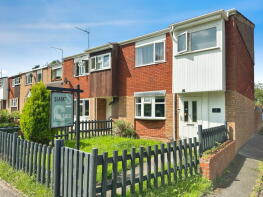
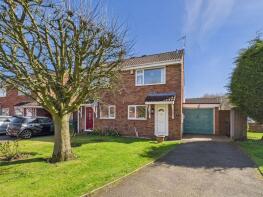
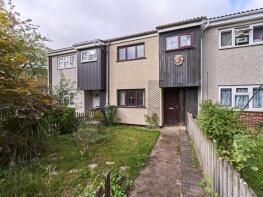
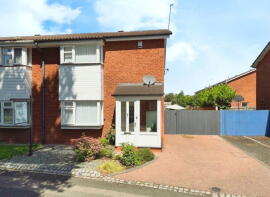
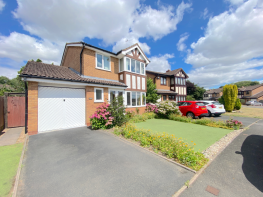
The majority of properties sold in Pendeford during the last year were semi-detached properties, selling for an average price of £204,029. Terraced properties sold for an average of £165,853, with detached properties fetching £277,417.
Overall, the historical sold prices in Pendeford over the last year were 8% down on the previous year and 3% down on the 2023 peak of £207,651.
Properties Sold
5, Solent Close, Wolverhampton WV9 5QF
| Today | See what it's worth now |
| 27 Apr 2026 | £155,000 |
| 10 Nov 1995 | £41,000 |
No other historical records.
23, Smallwood Road, Wolverhampton WV8 1UE

| Today | See what it's worth now |
| 31 Mar 2026 | £160,000 |
| 24 Sep 2008 | £70,000 |
No other historical records.
27, Tebworth Close, Wolverhampton WV9 5QX
| Today | See what it's worth now |
| 20 Mar 2026 | £192,000 |
| 21 Jul 2021 | £150,000 |
No other historical records.
58, Eastney Crescent, Wolverhampton WV8 1YQ
| Today | See what it's worth now |
| 18 Mar 2026 | £215,000 |
| 11 Mar 2022 | £180,000 |
No other historical records.
14, Marholm Close, Wolverhampton WV9 5QY
| Today | See what it's worth now |
| 12 Mar 2026 | £102,000 |
| 17 Dec 1997 | £25,000 |
No other historical records.
7, Mirfield Close, Wolverhampton WV9 5RW
| Today | See what it's worth now |
| 27 Feb 2026 | £295,000 |
| 28 Jun 2004 | £135,000 |
54, Weyhill Close, Wolverhampton WV9 5RA
| Today | See what it's worth now |
| 23 Feb 2026 | £140,000 |
| 7 Feb 2020 | £97,000 |
No other historical records.
60, Clewley Drive, Wolverhampton WV9 5LA
| Today | See what it's worth now |
| 16 Feb 2026 | £267,000 |
| 30 Sep 2020 | £195,000 |
No other historical records.
8, Howland Close, Wolverhampton WV9 5PY
| Today | See what it's worth now |
| 26 Jan 2026 | £200,000 |
| 19 Sep 2008 | £109,500 |
10, Solent Close, Wolverhampton WV9 5QF
| Today | See what it's worth now |
| 16 Jan 2026 | £178,000 |
| 24 Oct 2019 | £127,000 |
10, The Covert, Wolverhampton WV8 1UF
| Today | See what it's worth now |
| 15 Jan 2026 | £140,000 |
No other historical records.
48, Eastney Crescent, Wolverhampton WV8 1YQ

| Today | See what it's worth now |
| 6 Jan 2026 | £175,000 |
| 15 Mar 2002 | £47,000 |
37, Eastney Crescent, Wolverhampton WV8 1YQ
| Today | See what it's worth now |
| 19 Dec 2025 | £200,000 |
| 15 Feb 2013 | £89,500 |
No other historical records.
6, Hedgerow Walk, Wolverhampton WV8 1UW
| Today | See what it's worth now |
| 19 Dec 2025 | £194,000 |
| 5 Dec 2018 | £127,500 |
No other historical records.
6, Weyhill Close, Wolverhampton WV9 5RA
| Today | See what it's worth now |
| 9 Dec 2025 | £182,500 |
| 5 Jul 2000 | £51,500 |
40, Barnhurst Lane, Wolverhampton WV8 1XB

| Today | See what it's worth now |
| 26 Nov 2025 | £168,000 |
No other historical records.
232, The Droveway, Wolverhampton WV9 5ND
| Today | See what it's worth now |
| 25 Nov 2025 | £190,000 |
| 15 Aug 2014 | £115,000 |
54, Wayside, Wolverhampton WV8 1TB
| Today | See what it's worth now |
| 20 Nov 2025 | £155,000 |
| 5 Jan 2005 | £96,500 |
83, Penshaw Close, Wolverhampton WV9 5NG
| Today | See what it's worth now |
| 14 Nov 2025 | £190,000 |
No other historical records.
18, Earlswood Crescent, Pendeford, Wolverhampton WV9 5RL
| Today | See what it's worth now |
| 13 Nov 2025 | £273,000 |
No other historical records.
88, Leybourne Crescent, Wolverhampton WV9 5QG
| Today | See what it's worth now |
| 10 Nov 2025 | £195,000 |
| 20 Sep 2021 | £152,500 |
22, Millwalk Drive, Wolverhampton WV9 5LG
| Today | See what it's worth now |
| 7 Nov 2025 | £279,500 |
| 31 Jan 2022 | £275,000 |
23, Talaton Close, Wolverhampton WV9 5LR
| Today | See what it's worth now |
| 31 Oct 2025 | £120,000 |
| 23 Sep 2015 | £65,000 |
Source Acknowledgement: © Crown copyright. England and Wales house price data is publicly available information produced by the HM Land Registry.This material was last updated on 9 July 2026. It covers the period from 1 January 1995 to 30 April 2026 and contains property transactions which have been registered during that period. Contains HM Land Registry data © Crown copyright and database right 2026. This data is licensed under the Open Government Licence v3.0.
Disclaimer: Rightmove.co.uk provides this HM Land Registry data "as is". The burden for fitness of the data relies completely with the user and is provided for informational purposes only. No warranty, express or implied, is given relating to the accuracy of content of the HM Land Registry data and Rightmove does not accept any liability for error or omission. If you have found an error with the data or need further information please contact HM Land Registry.
Permitted Use: Viewers of this Information are granted permission to access this Crown copyright material and to download it onto electronic, magnetic, optical or similar storage media provided that such activities are for private research, study or in-house use only. Any other use of the material requires the formal written permission of Land Registry which can be requested from us, and is subject to an additional licence and associated charge.
Rightmove takes no liability for your use of, or reliance on, Rightmove's Instant Valuation due to the limitations of our tracking tool listed here. Use of this tool is taken entirely at your own risk. All rights reserved.