
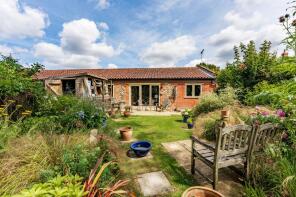
House Prices in Pennygate
House prices in Pennygate have an overall average of £427,656 over the last year.
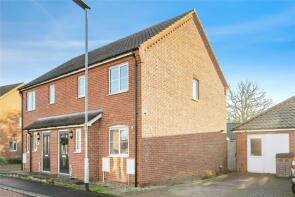
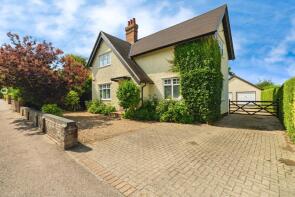
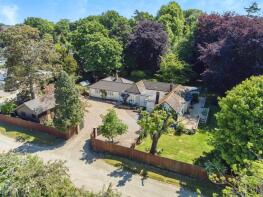
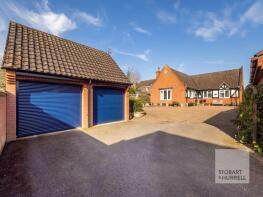
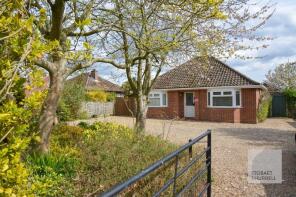
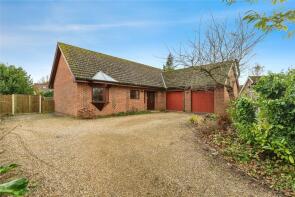
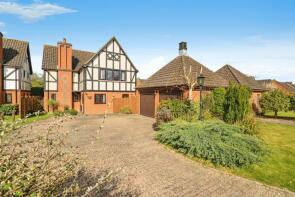
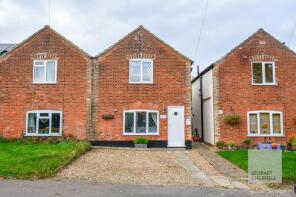
The majority of properties sold in Pennygate during the last year were detached properties, selling for an average price of £501,437. Semi-detached properties sold for an average of £323,950, with terraced properties fetching £318,100.
Overall, the historical sold prices in Pennygate over the last year were 1% down on the previous year and 11% down on the 2022 peak of £480,101.
Properties Sold
4, Laurel Farm Barns, Market Street, Norwich NR12 8QY
| Today | See what it's worth now |
| 19 Jan 2026 | £395,000 |
| 31 May 2019 | £315,000 |
4, Burnt Fen Way, Norwich NR12 8GJ
| Today | See what it's worth now |
| 12 Jan 2026 | £310,000 |
| 1 Jul 2014 | £232,000 |
No other historical records.
26, Tunstead Road, Norwich NR12 8QN
| Today | See what it's worth now |
| 7 Jan 2026 | £190,000 |
| 9 Jul 2013 | £121,000 |
No other historical records.
64, Grange Close, Norwich NR12 8EB

| Today | See what it's worth now |
| 5 Dec 2025 | £390,000 |
| 29 Sep 2006 | £210,000 |
No other historical records.
Dabchick Manor, Brimbelow Road, Norwich NR12 8UJ

| Today | See what it's worth now |
| 28 Nov 2025 | £172,000 |
| 12 Oct 2017 | £209,000 |
No other historical records.
3, Decoy Drive, Norwich NR12 8GF

| Today | See what it's worth now |
| 28 Nov 2025 | £310,000 |
| 24 May 2019 | £246,500 |
5, Crowgate Estate, Crowgate Street, Norwich NR12 8RE
| Today | See what it's worth now |
| 26 Nov 2025 | £290,000 |
| 7 May 2021 | £255,000 |
16, Burnt Fen Way, Norwich NR12 8GJ
| Today | See what it's worth now |
| 21 Nov 2025 | £245,000 |
| 31 Oct 2014 | £196,950 |
No other historical records.
Field Cottage, Horning Road, Norwich NR12 8JN
| Today | See what it's worth now |
| 21 Nov 2025 | £415,000 |
| 10 Jul 2018 | £300,000 |
Beech Lodge, Horning Road West, Norwich NR12 8QJ
| Today | See what it's worth now |
| 19 Nov 2025 | £725,000 |
| 17 Dec 1999 | £130,000 |
No other historical records.
Plot 1g, Bureside Estate, Crabbetts Marsh, Horning NR12 8JP


| Today | See what it's worth now |
| 6 Nov 2025 | £159,000 |
| 28 Feb 1997 | £20,000 |
No other historical records.
25, Abbot Road, Norwich NR12 8PN
| Today | See what it's worth now |
| 5 Nov 2025 | £478,000 |
| 22 Aug 2019 | £307,500 |
No other historical records.
13, Laurel Farm Barns, Market Street, Norwich NR12 8QY
| Today | See what it's worth now |
| 5 Nov 2025 | £310,000 |
| 12 Jul 2011 | £191,000 |
No other historical records.
32, The Avenue, Norwich NR12 8TR
| Today | See what it's worth now |
| 4 Nov 2025 | £715,000 |
| 19 Mar 2003 | £260,000 |
No other historical records.
25, Waveney Drive, Norwich NR12 8DP
| Today | See what it's worth now |
| 4 Nov 2025 | £540,000 |
| 11 Jun 2015 | £355,000 |
41, Burnt Fen Way, Hoveton NR12 8GJ
| Today | See what it's worth now |
| 3 Nov 2025 | £400,000 |
No other historical records.
Annexe At, 140, Stalham Road, Hoveton NR12 8EE
| Today | See what it's worth now |
| 30 Oct 2025 | £385,000 |
No other historical records.
16 The Bungalow, Grange Walk, Norwich NR12 8RS
| Today | See what it's worth now |
| 17 Oct 2025 | £400,000 |
| 25 Sep 1995 | £96,000 |
No other historical records.
11, Abbot Road, Norwich NR12 8PN
| Today | See what it's worth now |
| 10 Oct 2025 | £515,000 |
| 3 Nov 2020 | £425,000 |
Beech Tree Cottage, Upper Street, Horning NR12 8NG
| Today | See what it's worth now |
| 3 Oct 2025 | £225,000 |
| 18 Sep 2020 | £211,000 |
2, Preston Close, Norwich NR12 8SP
| Today | See what it's worth now |
| 26 Sep 2025 | £444,800 |
| 21 May 2021 | £100,000 |
No other historical records.
1 Harrodan, Church Road, Norwich NR12 8YL
| Today | See what it's worth now |
| 25 Sep 2025 | £287,500 |
| 20 Jul 2018 | £230,000 |
No other historical records.
30, St Margarets Gardens, Norwich NR12 8DN
| Today | See what it's worth now |
| 19 Sep 2025 | £180,000 |
| 16 Aug 2006 | £130,000 |
No other historical records.
17, Petersfield Drive, Norwich NR12 8FB
| Today | See what it's worth now |
| 19 Sep 2025 | £390,000 |
| 23 May 2014 | £260,000 |
No other historical records.
1 Seven Oaks, Summer Drive, Norwich NR12 8DY

| Today | See what it's worth now |
| 18 Sep 2025 | £860,000 |
No other historical records.
Source Acknowledgement: © Crown copyright. England and Wales house price data is publicly available information produced by the HM Land Registry.This material was last updated on 4 February 2026. It covers the period from 1 January 1995 to 24 December 2025 and contains property transactions which have been registered during that period. Contains HM Land Registry data © Crown copyright and database right 2026. This data is licensed under the Open Government Licence v3.0.
Disclaimer: Rightmove.co.uk provides this HM Land Registry data "as is". The burden for fitness of the data relies completely with the user and is provided for informational purposes only. No warranty, express or implied, is given relating to the accuracy of content of the HM Land Registry data and Rightmove does not accept any liability for error or omission. If you have found an error with the data or need further information please contact HM Land Registry.
Permitted Use: Viewers of this Information are granted permission to access this Crown copyright material and to download it onto electronic, magnetic, optical or similar storage media provided that such activities are for private research, study or in-house use only. Any other use of the material requires the formal written permission of Land Registry which can be requested from us, and is subject to an additional licence and associated charge.
Map data ©OpenStreetMap contributors.
Rightmove takes no liability for your use of, or reliance on, Rightmove's Instant Valuation due to the limitations of our tracking tool listed here. Use of this tool is taken entirely at your own risk. All rights reserved.