
House Prices in Pentre'R Eglwys
House prices in Pentre'R Eglwys have an overall average of £272,601 over the last year.
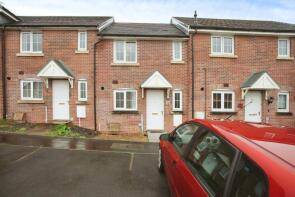
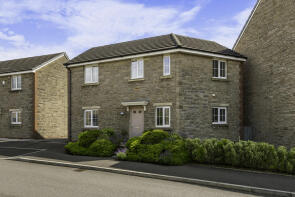
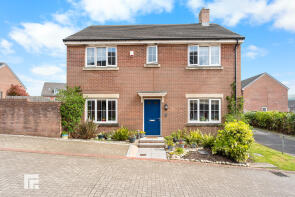
The majority of properties sold in Pentre'R Eglwys during the last year were detached properties, selling for an average price of £357,195. Semi-detached properties sold for an average of £246,265, with terraced properties fetching £187,608.
Overall, the historical sold prices in Pentre'R Eglwys over the last year were 3% down on the previous year and 5% up on the 2022 peak of £259,720.
Properties Sold
3, Alma Terrace, Pontypridd CF38 1RD
| Today | See what it's worth now |
| 19 Dec 2025 | £135,000 |
| 10 Nov 2021 | £114,950 |
No other historical records.
2, Station Road, Pontypridd CF38 1AH

| Today | See what it's worth now |
| 11 Dec 2025 | £152,000 |
| 24 Apr 1998 | £39,500 |
No other historical records.
12, Ruthin Way, Tonteg, Ton-teg CF38 1TF
| Today | See what it's worth now |
| 8 Dec 2025 | £265,000 |
No other historical records.
36, Dyffryn Y Coed, Pontypridd CF38 1PQ
| Today | See what it's worth now |
| 8 Dec 2025 | £369,950 |
| 29 Sep 2017 | £259,950 |
34, Church Road, Pontypridd CF38 1EH
| Today | See what it's worth now |
| 3 Dec 2025 | £337,000 |
| 23 Apr 2021 | £230,000 |
No other historical records.
14, Cheriton Grove, Pontypridd CF38 1PF
| Today | See what it's worth now |
| 27 Nov 2025 | £370,000 |
| 15 Mar 2019 | £279,000 |
No other historical records.
Bronhelwen, Tir Y Coed, Parc Nant Celyn, Efail Isaf, Efailisaf CF38 1AJ
| Today | See what it's worth now |
| 13 Nov 2025 | £675,000 |
| 12 Aug 2003 | £330,000 |
No other historical records.
34, Dyffryn Y Coed, Pontypridd CF38 1PQ
| Today | See what it's worth now |
| 30 Oct 2025 | £365,000 |
| 28 Feb 2019 | £284,500 |
15, Meadow Brook, Pontypridd CF38 1DJ
| Today | See what it's worth now |
| 30 Oct 2025 | £515,000 |
| 12 May 2016 | £365,000 |
254, Dyffryn Y Coed, Pontypridd CF38 1QA
| Today | See what it's worth now |
| 24 Oct 2025 | £195,000 |
| 9 Dec 2021 | £175,000 |
33, Llanberis Close, Pontypridd CF38 1HR

| Today | See what it's worth now |
| 6 Oct 2025 | £284,950 |
| 13 Dec 2002 | £134,950 |
53, Dyffryn Y Coed, Pontypridd CF38 1PJ
| Today | See what it's worth now |
| 3 Oct 2025 | £305,000 |
| 23 Dec 2014 | £189,995 |
No other historical records.
141, Dyffryn Y Coed, Pontypridd CF38 1QB
| Today | See what it's worth now |
| 25 Sep 2025 | £365,000 |
| 31 May 2017 | £268,000 |
No other historical records.
59, Oakfield Crescent, Pontypridd CF38 1NG
| Today | See what it's worth now |
| 27 Aug 2025 | £215,000 |
| 29 Nov 2013 | £144,950 |
No other historical records.
13, Fardre Crescent, Pontypridd CF38 1DU
| Today | See what it's worth now |
| 22 Aug 2025 | £179,950 |
| 8 Jul 2016 | £102,000 |
22 Marslade, Duffryn Bach Terrace, Pontypridd CF38 1AL
| Today | See what it's worth now |
| 15 Aug 2025 | £245,000 |
| 3 Aug 2007 | £152,000 |
No other historical records.
18, Meadow Crescent, Pontypridd CF38 1NL
| Today | See what it's worth now |
| 15 Aug 2025 | £220,090 |
| 31 Mar 2006 | £130,000 |
No other historical records.
7, Dyffryn Terrace, Main Road, Pontypridd CF38 1RE
| Today | See what it's worth now |
| 13 Aug 2025 | £189,950 |
| 5 Aug 2020 | £139,950 |
13, Ty Twyn, Pontypridd CF38 1UJ


| Today | See what it's worth now |
| 1 Aug 2025 | £189,000 |
| 1 Sep 1995 | £42,995 |
No other historical records.
41, Fleming Walk, Pontypridd CF38 1GF
| Today | See what it's worth now |
| 31 Jul 2025 | £107,000 |
| 16 Dec 2021 | £98,950 |
34, Parc Nant Celyn, Efail Isaf, Efailisaf CF38 1AD
| Today | See what it's worth now |
| 28 Jul 2025 | £450,000 |
No other historical records.
163, Dyffryn Y Coed, Pontypridd CF38 1QB

| Today | See what it's worth now |
| 28 Jul 2025 | £352,000 |
| 7 Feb 2020 | £271,500 |
56, Fleming Walk, Pontypridd CF38 1GF

| Today | See what it's worth now |
| 28 Jul 2025 | £130,000 |
| 1 Apr 2021 | £104,000 |
5, Lister Close, Pontypridd CF38 1GL
| Today | See what it's worth now |
| 22 Jul 2025 | £378,000 |
| 23 Jun 2005 | £234,950 |
No other historical records.
22, Butterfly Close, Pontypridd CF38 1AZ
| Today | See what it's worth now |
| 18 Jul 2025 | £340,000 |
| 27 May 2005 | £183,000 |
No other historical records.
Source Acknowledgement: © Crown copyright. England and Wales house price data is publicly available information produced by the HM Land Registry.This material was last updated on 4 February 2026. It covers the period from 1 January 1995 to 24 December 2025 and contains property transactions which have been registered during that period. Contains HM Land Registry data © Crown copyright and database right 2026. This data is licensed under the Open Government Licence v3.0.
Disclaimer: Rightmove.co.uk provides this HM Land Registry data "as is". The burden for fitness of the data relies completely with the user and is provided for informational purposes only. No warranty, express or implied, is given relating to the accuracy of content of the HM Land Registry data and Rightmove does not accept any liability for error or omission. If you have found an error with the data or need further information please contact HM Land Registry.
Permitted Use: Viewers of this Information are granted permission to access this Crown copyright material and to download it onto electronic, magnetic, optical or similar storage media provided that such activities are for private research, study or in-house use only. Any other use of the material requires the formal written permission of Land Registry which can be requested from us, and is subject to an additional licence and associated charge.
Map data ©OpenStreetMap contributors.
Rightmove takes no liability for your use of, or reliance on, Rightmove's Instant Valuation due to the limitations of our tracking tool listed here. Use of this tool is taken entirely at your own risk. All rights reserved.