
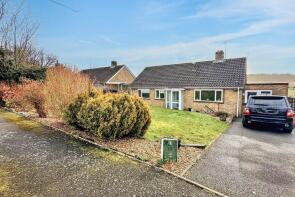
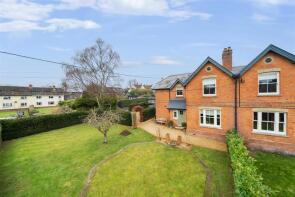
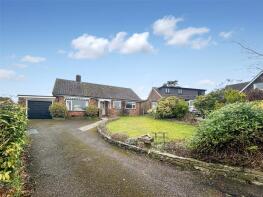
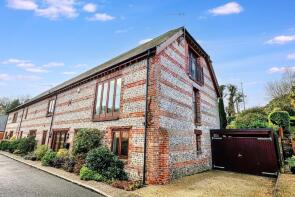
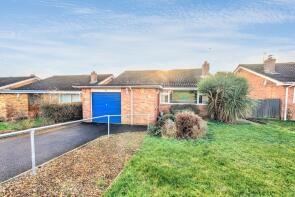
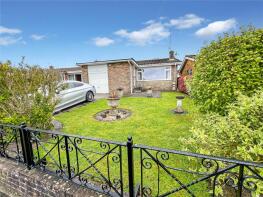
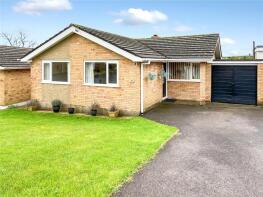
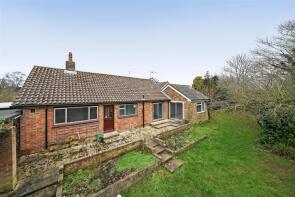
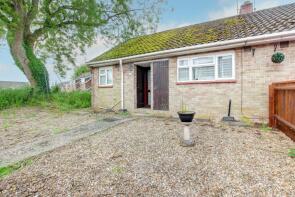
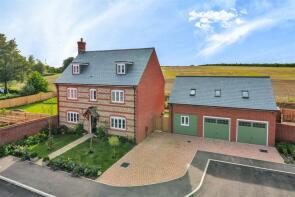
House Prices in Pimperne
House prices in Pimperne have an overall average of £395,667 over the last year.
The majority of properties sold in Pimperne during the last year were detached properties, selling for an average price of £424,125. Terraced properties sold for an average of £320,000, with semi-detached properties fetching £395,000.
Overall, the historical sold prices in Pimperne over the last year were 3% up on the previous year and 20% down on the 2022 peak of £495,896.
Properties Sold
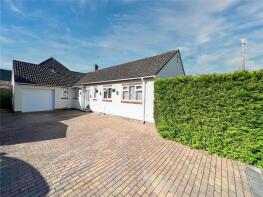
4, Boyte Road, Blandford Forum DT11 8UY
| Today | See what it's worth now |
| 13 Mar 2026 | £395,000 |
| 7 Apr 2016 | £297,500 |
No other historical records.
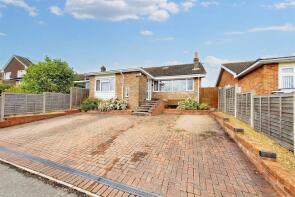
28, Old Bakery Close, Blandford Forum DT11 8BS
| Today | See what it's worth now |
| 30 Jan 2026 | £250,000 |
| 23 Mar 2022 | £275,000 |
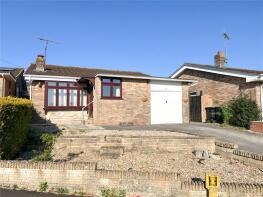
1, Fiveways Cottages, Church Road, Blandford Forum DT11 8XB
| Today | See what it's worth now |
| 9 Jan 2026 | £375,000 |
| 2 Dec 2020 | £340,000 |
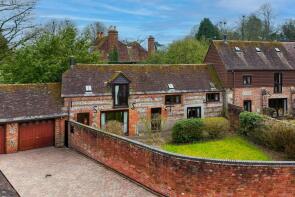
14, Berkeley Rise, Blandford Forum DT11 8UE
| Today | See what it's worth now |
| 12 Dec 2025 | £460,000 |
| 10 May 2000 | £118,000 |
10, Willow Park, Church Road, Blandford Forum DT11 8UB
| Today | See what it's worth now |
| 19 Nov 2025 | £270,000 |
No other historical records.
6, Portman Road, Blandford Forum DT11 8UJ
| Today | See what it's worth now |
| 6 Nov 2025 | £484,000 |
| 9 Sep 2016 | £320,000 |
6, Collingwood Close, Blandford Forum DT11 8XQ
| Today | See what it's worth now |
| 6 Nov 2025 | £460,000 |
| 30 Jun 2017 | £320,000 |
1, Hyde Gardens, Blandford Forum DT11 8XG

| Today | See what it's worth now |
| 1 Nov 2025 | £410,000 |
| 26 Apr 2024 | £400,000 |
17, Frampton Road, Blandford Forum DT11 8UU
| Today | See what it's worth now |
| 10 Oct 2025 | £445,000 |
| 22 Nov 2013 | £210,000 |
5, Boyte Road, Pimperne DT11 8UY
| Today | See what it's worth now |
| 15 Aug 2025 | £340,000 |
No other historical records.
The Granary, Chestnut Farm, Church Road, Pimperne DT11 8UB
| Today | See what it's worth now |
| 31 Jul 2025 | £440,000 |
No other historical records.
15, Portman Road, Blandford Forum DT11 8UJ
| Today | See what it's worth now |
| 30 Jul 2025 | £419,000 |
| 24 May 2019 | £322,500 |
50 The Little Thatch, Salisbury Road, Blandford Forum DT11 8UN
| Today | See what it's worth now |
| 28 May 2025 | £250,000 |
| 14 Jan 2014 | £110,000 |
31, Walters Drive, Blandford Forum DT11 8UX

| Today | See what it's worth now |
| 23 May 2025 | £385,000 |
| 3 Jul 2002 | £157,500 |
No other historical records.
24, Church Road, Blandford Forum DT11 8UB
| Today | See what it's worth now |
| 9 May 2025 | £470,000 |
| 24 Feb 2023 | £490,000 |
5, Portman Road, Pimperne DT11 8UJ
| Today | See what it's worth now |
| 30 Apr 2025 | £350,000 |
No other historical records.
5, Manor Farm Close, Blandford Forum DT11 8XL
| Today | See what it's worth now |
| 24 Apr 2025 | £630,000 |
| 5 Apr 2007 | £480,000 |
No other historical records.
14, Walters Drive, Blandford Forum DT11 8UX
| Today | See what it's worth now |
| 17 Apr 2025 | £320,000 |
| 25 May 2021 | £299,950 |
15, Walters Drive, Blandford Forum DT11 8UX
| Today | See what it's worth now |
| 17 Apr 2025 | £345,000 |
| 20 Jul 2017 | £270,000 |
10, Boyte Road, Blandford Forum DT11 8UY
| Today | See what it's worth now |
| 7 Apr 2025 | £412,500 |
| 4 Apr 2014 | £230,000 |
No other historical records.
13 Mai Dun, Portman Road, Blandford Forum DT11 8UJ
| Today | See what it's worth now |
| 12 Mar 2025 | £371,500 |
| 20 Apr 2015 | £275,000 |
1, Berkeley Road, Pimperne DT11 8TY
| Today | See what it's worth now |
| 7 Mar 2025 | £180,000 |
No other historical records.
3, Stable Court, Down Road, Pimperne DT11 8UP
| Today | See what it's worth now |
| 24 Jan 2025 | £395,000 |
No other historical records.
Source Acknowledgement: © Crown copyright. England and Wales house price data is publicly available information produced by the HM Land Registry.This material was last updated on 15 May 2026. It covers the period from 1 January 1995 to 31 March 2026 and contains property transactions which have been registered during that period. Contains HM Land Registry data © Crown copyright and database right 2026. This data is licensed under the Open Government Licence v3.0.
Disclaimer: Rightmove.co.uk provides this HM Land Registry data "as is". The burden for fitness of the data relies completely with the user and is provided for informational purposes only. No warranty, express or implied, is given relating to the accuracy of content of the HM Land Registry data and Rightmove does not accept any liability for error or omission. If you have found an error with the data or need further information please contact HM Land Registry.
Permitted Use: Viewers of this Information are granted permission to access this Crown copyright material and to download it onto electronic, magnetic, optical or similar storage media provided that such activities are for private research, study or in-house use only. Any other use of the material requires the formal written permission of Land Registry which can be requested from us, and is subject to an additional licence and associated charge.
Map data ©OpenStreetMap contributors.
Rightmove takes no liability for your use of, or reliance on, Rightmove's Instant Valuation due to the limitations of our tracking tool listed here. Use of this tool is taken entirely at your own risk. All rights reserved.