
House Prices in Pippins Estate
House prices in Pippins Estate have an overall average of £603,120 over the last year.
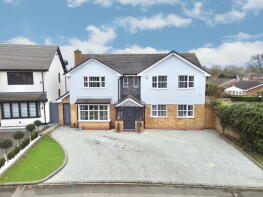
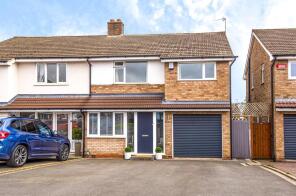
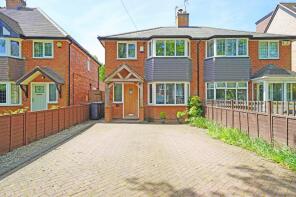
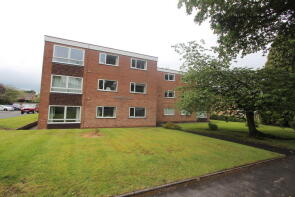
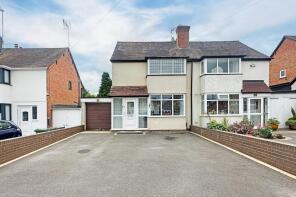
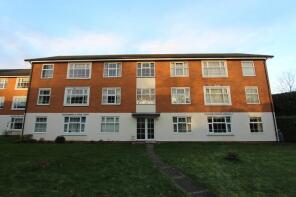
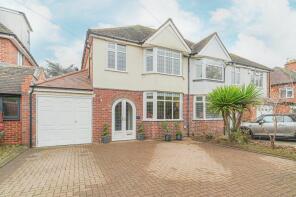
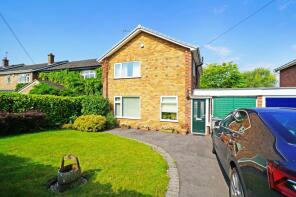
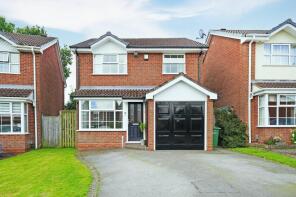
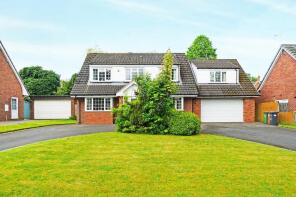
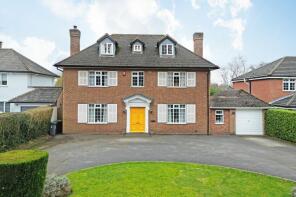
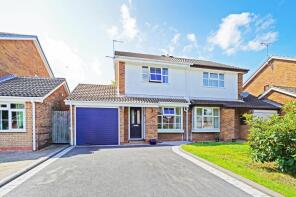
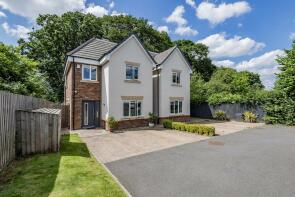
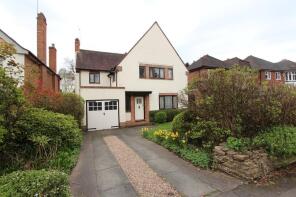
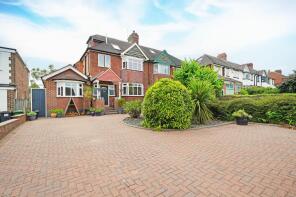
The majority of properties sold in Pippins Estate during the last year were detached properties, selling for an average price of £781,625. Semi-detached properties sold for an average of £476,406, with flats fetching £261,000.
Overall, the historical sold prices in Pippins Estate over the last year were 7% up on the previous year and 4% up on the 2022 peak of £581,723.
Properties Sold
9, Willowbank Road, Knowle, Solihull B93 9QH
| Today | See what it's worth now |
| 6 Jun 2025 | £895,000 |
| 29 Sep 2017 | £640,000 |
6, Whateley Hall Close, Knowle, Solihull B93 9NL
| Today | See what it's worth now |
| 5 Jun 2025 | £518,000 |
| 4 Jul 2016 | £325,000 |
339, Widney Road, Bentley Heath, Solihull B93 9BQ
| Today | See what it's worth now |
| 21 May 2025 | £495,000 |
| 24 Jun 2016 | £357,000 |
Flat 8, Byron Court, Longdon Road, Knowle, Solihull B93 9HX
| Today | See what it's worth now |
| 16 May 2025 | £222,500 |
| 9 Nov 2007 | £181,500 |
2, Bretby Close, Bentley Heath, Solihull B93 9BY
| Today | See what it's worth now |
| 31 Mar 2025 | £467,500 |
| 11 Dec 2017 | £400,000 |
48, Broadfern Road, Knowle, Solihull B93 9DD
| Today | See what it's worth now |
| 31 Mar 2025 | £674,000 |
| 23 Jun 2014 | £499,999 |
163, Tilehouse Green Lane, Knowle, Solihull B93 9EB
| Today | See what it's worth now |
| 27 Mar 2025 | £435,000 |
| 21 May 2018 | £362,000 |
No other historical records.
1469, Warwick Road, Knowle, Solihull B93 9LU
| Today | See what it's worth now |
| 27 Mar 2025 | £702,000 |
| 27 Mar 2025 | £702,000 |
81, Longdon Road, Knowle, Solihull B93 9HT
| Today | See what it's worth now |
| 25 Mar 2025 | £380,000 |
| 21 Jul 2011 | £240,000 |
5, Gainsborough Crescent, Knowle, Solihull B93 9EX


| Today | See what it's worth now |
| 28 Feb 2025 | £582,500 |
No other historical records.
Flat 10, Starbold Court, Starbold Crescent, Knowle, Solihull B93 9LB
| Today | See what it's worth now |
| 28 Feb 2025 | £196,000 |
No other historical records.
101, Widney Road, Bentley Heath, Solihull B93 9EA
| Today | See what it's worth now |
| 28 Feb 2025 | £508,000 |
| 26 Feb 2021 | £430,000 |
63, Newton Road, Knowle, Solihull B93 9HN
| Today | See what it's worth now |
| 17 Feb 2025 | £490,000 |
| 7 Dec 2010 | £295,000 |
No other historical records.
42, Moorfield Avenue, Knowle, Solihull B93 9RA
| Today | See what it's worth now |
| 31 Jan 2025 | £565,000 |
| 21 Nov 2014 | £370,000 |
33, Easenhall Close, Knowle, Solihull B93 9QA
| Today | See what it's worth now |
| 31 Jan 2025 | £837,500 |
| 8 Apr 2011 | £430,000 |
No other historical records.
32, Tilehouse Green Lane, Knowle, Solihull B93 9EY
| Today | See what it's worth now |
| 24 Jan 2025 | £1,025,000 |
No other historical records.
12, Needhill Close, Knowle, Solihull B93 9QS
| Today | See what it's worth now |
| 24 Jan 2025 | £375,000 |
| 1 Nov 2012 | £217,000 |
No other historical records.
178a, Tilehouse Green Lane, Knowle, Solihull B93 9EJ
| Today | See what it's worth now |
| 23 Jan 2025 | £699,000 |
| 30 Sep 2021 | £612,250 |
No other historical records.
30, Wychwood Avenue, Knowle, Solihull B93 9DG
| Today | See what it's worth now |
| 17 Jan 2025 | £940,500 |
| 23 Aug 2017 | £699,950 |
Apartment 6, The Old School House, Widney Road, Bentley Heath, Solihull B93 9BH
| Today | See what it's worth now |
| 17 Jan 2025 | £425,000 |
| 16 Feb 2007 | £250,000 |
129, Longdon Road, Knowle, Solihull B93 9HY
| Today | See what it's worth now |
| 3 Jan 2025 | £585,000 |
| 22 May 1995 | £95,000 |
No other historical records.
10, Moorfield Avenue, Knowle, Solihull B93 9RE
| Today | See what it's worth now |
| 17 Dec 2024 | £652,000 |
| 6 Sep 2007 | £340,000 |
19, Needhill Close, Knowle, Solihull B93 9QS
| Today | See what it's worth now |
| 13 Dec 2024 | £360,000 |
| 1 Aug 2014 | £249,950 |
50, Barcheston Road, Knowle, Solihull B93 9JT
| Today | See what it's worth now |
| 13 Dec 2024 | £600,000 |
No other historical records.
60, Lady Byron Lane, Knowle, Solihull B93 9AY
| Today | See what it's worth now |
| 11 Dec 2024 | £1,360,000 |
| 6 Aug 1997 | £375,000 |
No other historical records.
Get ready with a Mortgage in Principle
- Personalised result in just 20 minutes
- Find out how much you can borrow
- Get viewings faster with agents
- No impact on your credit score
What's your property worth?
Source Acknowledgement: © Crown copyright. England and Wales house price data is publicly available information produced by the HM Land Registry.This material was last updated on 6 August 2025. It covers the period from 1 January 1995 to 30 June 2025 and contains property transactions which have been registered during that period. Contains HM Land Registry data © Crown copyright and database right 2025. This data is licensed under the Open Government Licence v3.0.
Disclaimer: Rightmove.co.uk provides this HM Land Registry data "as is". The burden for fitness of the data relies completely with the user and is provided for informational purposes only. No warranty, express or implied, is given relating to the accuracy of content of the HM Land Registry data and Rightmove does not accept any liability for error or omission. If you have found an error with the data or need further information please contact HM Land Registry.
Permitted Use: Viewers of this Information are granted permission to access this Crown copyright material and to download it onto electronic, magnetic, optical or similar storage media provided that such activities are for private research, study or in-house use only. Any other use of the material requires the formal written permission of Land Registry which can be requested from us, and is subject to an additional licence and associated charge.
Map data ©OpenStreetMap contributors.
Rightmove takes no liability for your use of, or reliance on, Rightmove's Instant Valuation due to the limitations of our tracking tool listed here. Use of this tool is taken entirely at your own risk. All rights reserved.