
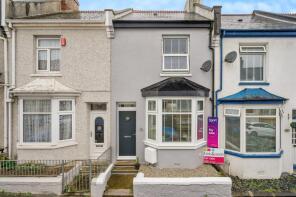
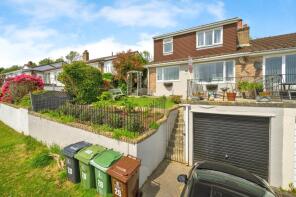
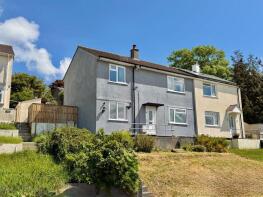
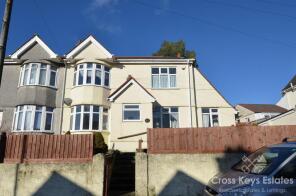
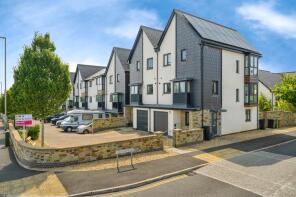
House Prices in Plymouth
House prices in Plymouth have an overall average of £249,471 over the last year.
The majority of properties sold in Plymouth during the last year were terraced properties, selling for an average price of £226,386. Semi-detached properties sold for an average of £271,571, with flats fetching £151,495.
Overall, the historical sold prices in Plymouth over the last year were similar to the previous year and 3% up on the 2023 peak of £241,938.
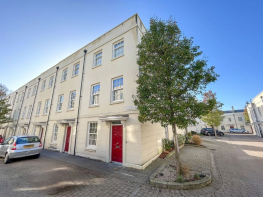
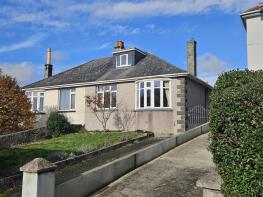
Properties Sold
Flat 1, 2, Trinity Street, Plymouth PL1 3GG
| Today | See what it's worth now |
| 24 Apr 2026 | £285,000 |
| 12 Dec 2022 | £263,000 |
47, Station Road, Keyham, Plymouth PL2 1NQ

| Today | See what it's worth now |
| 24 Apr 2026 | £225,000 |
| 19 Apr 2017 | £178,000 |
46, Colwill Road, Plymouth PL6 8RP
| Today | See what it's worth now |
| 24 Apr 2026 | £232,000 |
| 22 Jan 1999 | £62,500 |
No other historical records.
111, St Margarets Road, Plymouth PL7 4SB
| Today | See what it's worth now |
| 24 Apr 2026 | £307,500 |
| 8 Feb 2019 | £202,000 |
No other historical records.
32, Valley View Road, Plymouth PL3 6QJ
| Today | See what it's worth now |
| 24 Apr 2026 | £210,000 |
| 21 Feb 1997 | £51,950 |
No other historical records.
7, Molesworth Road, Plympton, Plymouth PL7 4NT

| Today | See what it's worth now |
| 24 Apr 2026 | £297,000 |
| 28 Jan 2025 | £212,000 |
No other historical records.
18, Victory Street, Plymouth PL2 2BY
| Today | See what it's worth now |
| 24 Apr 2026 | £174,000 |
| 10 Mar 2006 | £92,500 |
28, South View Park, Plymouth PL7 4JE
| Today | See what it's worth now |
| 22 Apr 2026 | £300,000 |
| 28 Sep 2012 | £160,000 |
147, Bampfylde Way, Plymouth PL6 6ST
| Today | See what it's worth now |
| 21 Apr 2026 | £215,000 |
| 18 Jun 2004 | £115,000 |
No other historical records.
38, Furneaux Avenue, Plymouth PL2 3HA
| Today | See what it's worth now |
| 21 Apr 2026 | £225,000 |
| 8 Aug 2017 | £170,000 |
No other historical records.
11, Esthwaite Lane, Plymouth PL6 5FQ
| Today | See what it's worth now |
| 20 Apr 2026 | £875,000 |
| 3 Aug 2018 | £760,000 |
No other historical records.
29c, Lipson Avenue, Plymouth PL4 8SQ
| Today | See what it's worth now |
| 20 Apr 2026 | £270,000 |
| 1 Apr 2021 | £230,000 |
27, Moreton Avenue, Plymouth PL6 5AZ
| Today | See what it's worth now |
| 20 Apr 2026 | £320,000 |
| 23 Jul 2008 | £176,000 |
No other historical records.
17, Frensham Gardens, Plymouth PL6 7JU
| Today | See what it's worth now |
| 17 Apr 2026 | £442,500 |
| 29 Jun 2023 | £452,000 |
No other historical records.
27, Widey View, Plymouth PL3 5JQ
| Today | See what it's worth now |
| 17 Apr 2026 | £234,000 |
| 1 Sep 2021 | £140,000 |
No other historical records.
Flat 2, 23, Hartley Road, Plymouth PL3 5LW
| Today | See what it's worth now |
| 17 Apr 2026 | £275,000 |
| 4 Dec 2018 | £360,000 |
No other historical records.
26, Seaton Place, Plymouth PL2 1PS

| Today | See what it's worth now |
| 17 Apr 2026 | £180,000 |
| 31 Jul 2025 | £175,000 |
298, Austin Crescent, Plymouth PL6 5WP

| Today | See what it's worth now |
| 17 Apr 2026 | £145,000 |
| 31 May 2024 | £135,000 |
12, Admiralty Street, Keyham, Plymouth PL2 2BP
| Today | See what it's worth now |
| 17 Apr 2026 | £167,500 |
| 23 Jul 2015 | £123,000 |
14, Home Sweet Home Terrace, Plymouth PL4 0QJ
| Today | See what it's worth now |
| 17 Apr 2026 | £147,500 |
| 4 Dec 2008 | £80,000 |
No other historical records.
170, Southway Drive, Plymouth PL6 6QF
| Today | See what it's worth now |
| 17 Apr 2026 | £205,000 |
| 1 Feb 2016 | £135,500 |
No other historical records.
46, Radar Road, Plymouth PL6 8DU
| Today | See what it's worth now |
| 17 Apr 2026 | £400,000 |
| 26 Feb 2016 | £250,000 |
No other historical records.
5, Moorland Gardens, Plymouth PL7 2FP
| Today | See what it's worth now |
| 17 Apr 2026 | £130,000 |
| 10 Jan 2003 | £66,500 |
Source Acknowledgement: © Crown copyright. England and Wales house price data is publicly available information produced by the HM Land Registry.This material was last updated on 9 July 2026. It covers the period from 1 January 1995 to 30 April 2026 and contains property transactions which have been registered during that period. Contains HM Land Registry data © Crown copyright and database right 2026. This data is licensed under the Open Government Licence v3.0.
Disclaimer: Rightmove.co.uk provides this HM Land Registry data "as is". The burden for fitness of the data relies completely with the user and is provided for informational purposes only. No warranty, express or implied, is given relating to the accuracy of content of the HM Land Registry data and Rightmove does not accept any liability for error or omission. If you have found an error with the data or need further information please contact HM Land Registry.
Permitted Use: Viewers of this Information are granted permission to access this Crown copyright material and to download it onto electronic, magnetic, optical or similar storage media provided that such activities are for private research, study or in-house use only. Any other use of the material requires the formal written permission of Land Registry which can be requested from us, and is subject to an additional licence and associated charge.
Rightmove takes no liability for your use of, or reliance on, Rightmove's Instant Valuation due to the limitations of our tracking tool listed here. Use of this tool is taken entirely at your own risk. All rights reserved.