
House Prices in Polebrook
House prices in Polebrook have an overall average of £682,500 over the last year.
Overall, the historical sold prices in Polebrook over the last year were 58% down on the previous year and 13% up on the 2020 peak of £606,250.
Properties Sold
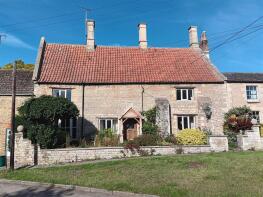
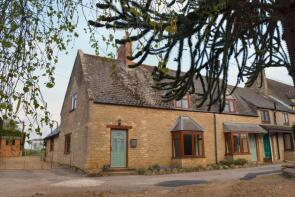
Greystone House, Church Row, Peterborough PE8 5LT
| Today | See what it's worth now |
| 22 Aug 2025 | £525,000 |
| 17 Feb 1997 | £230,000 |
No other historical records.
6, Fergusons Close, Polebrook PE8 5LH
| Today | See what it's worth now |
| 9 Jul 2025 | £840,000 |
No other historical records.
Willow Brook Cottage, Lutton Road, Peterborough PE8 5LX
| Today | See what it's worth now |
| 23 Jun 2025 | £9,000,000 |
| 31 Dec 1997 | £245,000 |
No other historical records.
2 Coin De La Rue, Duke Street, Peterborough PE8 5LP
| Today | See what it's worth now |
| 25 Mar 2025 | £380,000 |
| 10 May 2002 | £145,000 |
No other historical records.
The Gables, Kings Arms Lane, Peterborough PE8 5LW
| Today | See what it's worth now |
| 5 Mar 2025 | £845,000 |
| 21 Nov 2014 | £500,000 |
No other historical records.
2, Circus Grove, Peterborough PE8 5LE
| Today | See what it's worth now |
| 10 Oct 2024 | £1,280,000 |
| 4 Oct 2002 | £650,000 |
No other historical records.
Berryfield, Oundle Road, Peterborough PE8 5LQ

| Today | See what it's worth now |
| 19 Sep 2024 | £550,000 |
| 1 Sep 2014 | £335,000 |
3a, Church Row, Peterborough PE8 5LT

| Today | See what it's worth now |
| 12 Sep 2024 | £182,000 |
| 24 Feb 2012 | £123,500 |
4, Morgans Close, Peterborough PE8 5LU
| Today | See what it's worth now |
| 13 Aug 2024 | £327,500 |
| 5 Oct 2018 | £280,000 |
White Admiral, Lutton Road, Peterborough PE8 5LX

| Today | See what it's worth now |
| 5 Jul 2024 | £300,000 |
| 25 Jan 2018 | £230,000 |
No other historical records.
3b, Church Row, Peterborough PE8 5LT

| Today | See what it's worth now |
| 23 May 2024 | £200,000 |
| 24 Jun 2015 | £155,000 |
Swallowtail Cottage, Lutton Road, Peterborough PE8 5LX
| Today | See what it's worth now |
| 22 Jan 2024 | £507,000 |
| 6 Apr 2017 | £245,000 |
No other historical records.
Tocil House, Main Street, Peterborough PE8 5LN
| Today | See what it's worth now |
| 22 Sep 2023 | £477,500 |
No other historical records.
30, Hemington Road, Peterborough PE8 5LS
| Today | See what it's worth now |
| 4 Sep 2023 | £940,000 |
| 18 Nov 2005 | £650,000 |
No other historical records.
3c, Church Row, Peterborough PE8 5LT
| Today | See what it's worth now |
| 1 Sep 2023 | £210,000 |
| 17 Oct 2014 | £155,000 |
1 Blacksmiths Cottage, Hemington Road, Peterborough PE8 5LS

| Today | See what it's worth now |
| 7 Aug 2023 | £435,000 |
| 12 Feb 2021 | £330,000 |
No other historical records.
Brook House, Hemington Road, Peterborough PE8 5LS
| Today | See what it's worth now |
| 24 Mar 2023 | £790,000 |
No other historical records.
Greystones, Kings Arms Lane, Peterborough PE8 5LW
| Today | See what it's worth now |
| 23 Feb 2023 | £660,000 |
| 11 Oct 2007 | £185,000 |
Sage Green, Main Street, Peterborough PE8 5LN
| Today | See what it's worth now |
| 22 Dec 2022 | £430,000 |
| 6 Oct 2020 | £405,000 |
13, Morgans Close, Peterborough PE8 5LU
| Today | See what it's worth now |
| 2 Sep 2022 | £220,000 |
No other historical records.
Dukes Head Garden, Kings Arms Lane, Peterborough PE8 5LW

| Today | See what it's worth now |
| 28 Jan 2022 | £535,000 |
| 28 Apr 2017 | £430,000 |
33, Morgans Close, Peterborough PE8 5LU
| Today | See what it's worth now |
| 21 Oct 2021 | £340,000 |
| 3 May 2012 | £245,000 |
6, Morgans Close, Peterborough PE8 5LU
| Today | See what it's worth now |
| 30 Sep 2021 | £192,000 |
No other historical records.

Source Acknowledgement: © Crown copyright. England and Wales house price data is publicly available information produced by the HM Land Registry.This material was last updated on 9 July 2026. It covers the period from 1 January 1995 to 30 April 2026 and contains property transactions which have been registered during that period. Contains HM Land Registry data © Crown copyright and database right 2026. This data is licensed under the Open Government Licence v3.0.
Disclaimer: Rightmove.co.uk provides this HM Land Registry data "as is". The burden for fitness of the data relies completely with the user and is provided for informational purposes only. No warranty, express or implied, is given relating to the accuracy of content of the HM Land Registry data and Rightmove does not accept any liability for error or omission. If you have found an error with the data or need further information please contact HM Land Registry.
Permitted Use: Viewers of this Information are granted permission to access this Crown copyright material and to download it onto electronic, magnetic, optical or similar storage media provided that such activities are for private research, study or in-house use only. Any other use of the material requires the formal written permission of Land Registry which can be requested from us, and is subject to an additional licence and associated charge.
Rightmove takes no liability for your use of, or reliance on, Rightmove's Instant Valuation due to the limitations of our tracking tool listed here. Use of this tool is taken entirely at your own risk. All rights reserved.