
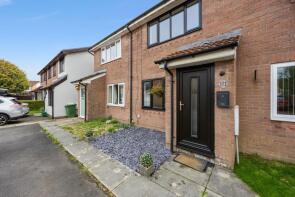
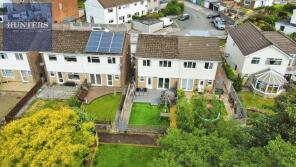
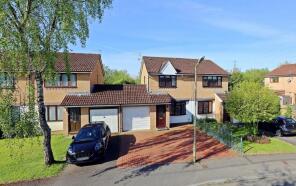
House Prices in Pontyclun
House prices in Pontyclun have an overall average of £282,334 over the last year.
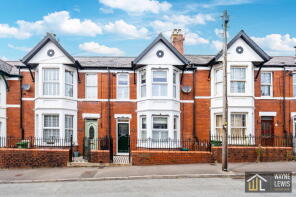
The majority of properties sold in Pontyclun during the last year were terraced properties, selling for an average price of £271,500. Semi-detached properties sold for an average of £260,470, with detached properties fetching £380,438.
Overall, the historical sold prices in Pontyclun over the last year were 3% up on the previous year and 8% up on the 2022 peak of £261,587.
Properties Sold
9, Derwen Road, Pontyclun CF72 9EJ
| Today | See what it's worth now |
| 2 Apr 2026 | £289,000 |
No other historical records.
172, Ynysddu, Pontyclun CF72 9UD
| Today | See what it's worth now |
| 2 Apr 2026 | £220,000 |
| 21 Oct 2022 | £190,000 |
No other historical records.
12, Llwynfen Road, Pontyclun CF72 9EL
| Today | See what it's worth now |
| 27 Mar 2026 | £378,000 |
| 19 Jul 2024 | £232,000 |
No other historical records.
46, Heol Miskin, Pontyclun CF72 9AJ
| Today | See what it's worth now |
| 20 Mar 2026 | £340,000 |
| 8 Oct 1999 | £94,000 |
No other historical records.
106, Llwyn Onn, Tyla Garw, Pontyclun CF72 9ET
| Today | See what it's worth now |
| 20 Mar 2026 | £182,000 |
| 22 Jul 2005 | £102,000 |
112, Llwyn Onn, Tyla Garw, Pontyclun CF72 9EU
| Today | See what it's worth now |
| 9 Mar 2026 | £240,000 |
| 25 Jun 2021 | £189,000 |
40, Meadow View, Tyla Garw, Pontyclun CF72 9FP

| Today | See what it's worth now |
| 27 Feb 2026 | £120,000 |
| 14 Dec 2012 | £70,000 |
29, Fair View Close, Pontyclun CF72 9EQ
| Today | See what it's worth now |
| 20 Feb 2026 | £157,000 |
No other historical records.
61, Cowbridge Road, Pontyclun CF72 9EB
| Today | See what it's worth now |
| 16 Feb 2026 | £321,000 |
| 29 Mar 2021 | £210,000 |
12, Fair View Close, Pontyclun CF72 9EP
| Today | See what it's worth now |
| 30 Jan 2026 | £225,000 |
No other historical records.
11, Maelog Close, Pontyclun CF72 9AF

| Today | See what it's worth now |
| 26 Jan 2026 | £285,000 |
| 17 Jun 2022 | £250,000 |
8, Heol Glan Elai, Pontyclun CF72 9DU
| Today | See what it's worth now |
| 19 Jan 2026 | £400,000 |
| 17 Jun 2016 | £280,000 |
16, Meadow Way, Tyla Garw, Pontyclun CF72 9FS

| Today | See what it's worth now |
| 19 Dec 2025 | £145,000 |
| 18 Sep 2020 | £117,000 |
4, Meadow Way, Tyla Garw, Pontyclun CF72 9FS
| Today | See what it's worth now |
| 17 Dec 2025 | £447,500 |
| 27 Oct 2014 | £230,000 |
43, Heol-y-coed, Pontyclun CF72 9AS
| Today | See what it's worth now |
| 16 Dec 2025 | £240,000 |
| 22 Dec 2011 | £80,000 |
No other historical records.
24, Rhyd-y-nant, Pontyclun CF72 9HE
| Today | See what it's worth now |
| 12 Dec 2025 | £295,000 |
No other historical records.
The Maple, Tyla Garw, Pontyclun CF72 9EZ
| Today | See what it's worth now |
| 12 Dec 2025 | £325,000 |
| 5 Feb 2021 | £260,000 |
68, Ynysddu, Pontyclun CF72 9UA
| Today | See what it's worth now |
| 14 Nov 2025 | £415,000 |
No other historical records.
14, Meadow Drive, Tyla Garw, Pontyclun CF72 9FR
| Today | See what it's worth now |
| 14 Nov 2025 | £285,000 |
| 28 Mar 2014 | £169,950 |
59, Coed Mieri, Tyla Garw, Pontyclun CF72 9UW
| Today | See what it's worth now |
| 14 Nov 2025 | £270,000 |
| 14 Oct 2022 | £242,000 |
26, Coed Mieri, Tyla Garw, Pontyclun CF72 9UW
| Today | See what it's worth now |
| 10 Nov 2025 | £182,500 |
| 30 Sep 2021 | £152,500 |
18, Meadow Way, Tyla Garw, Pontyclun CF72 9FS
| Today | See what it's worth now |
| 7 Nov 2025 | £135,000 |
| 15 Feb 2013 | £103,500 |
16, Maes-yr-afon, Pontyclun CF72 9DL
| Today | See what it's worth now |
| 31 Oct 2025 | £295,000 |
| 24 Sep 2021 | £275,000 |
No other historical records.

Source Acknowledgement: © Crown copyright. England and Wales house price data is publicly available information produced by the HM Land Registry.This material was last updated on 9 July 2026. It covers the period from 1 January 1995 to 30 April 2026 and contains property transactions which have been registered during that period. Contains HM Land Registry data © Crown copyright and database right 2026. This data is licensed under the Open Government Licence v3.0.
Disclaimer: Rightmove.co.uk provides this HM Land Registry data "as is". The burden for fitness of the data relies completely with the user and is provided for informational purposes only. No warranty, express or implied, is given relating to the accuracy of content of the HM Land Registry data and Rightmove does not accept any liability for error or omission. If you have found an error with the data or need further information please contact HM Land Registry.
Permitted Use: Viewers of this Information are granted permission to access this Crown copyright material and to download it onto electronic, magnetic, optical or similar storage media provided that such activities are for private research, study or in-house use only. Any other use of the material requires the formal written permission of Land Registry which can be requested from us, and is subject to an additional licence and associated charge.
Rightmove takes no liability for your use of, or reliance on, Rightmove's Instant Valuation due to the limitations of our tracking tool listed here. Use of this tool is taken entirely at your own risk. All rights reserved.