
House Prices in Portobello
House prices in Portobello have an overall average of £206,964 over the last year.
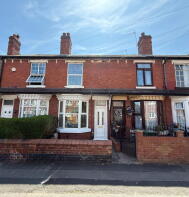
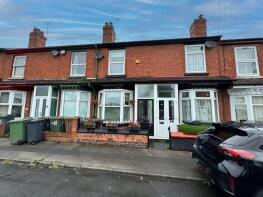
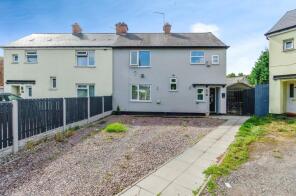
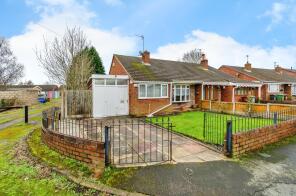
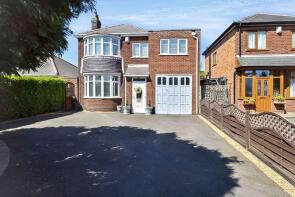
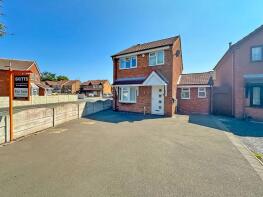
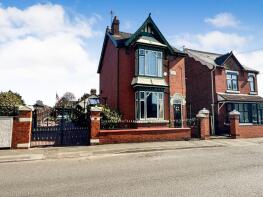
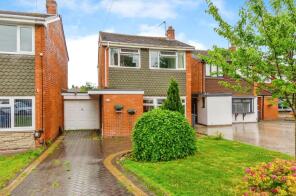
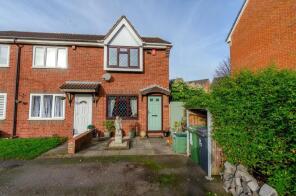
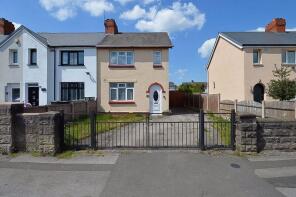
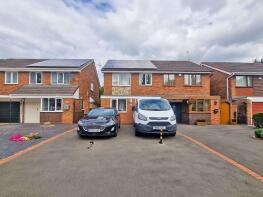
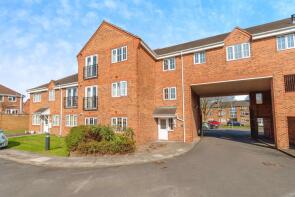
The majority of properties sold in Portobello during the last year were terraced properties, selling for an average price of £146,389. Detached properties sold for an average of £275,250, with semi-detached properties fetching £243,812.
Overall, the historical sold prices in Portobello over the last year were 9% up on the previous year and 20% up on the 2022 peak of £171,991.
Properties Sold
3, 1 Kingfisher Court, Clarkes Lane, Willenhall WV13 1JB
| Today | See what it's worth now |
| 27 Mar 2026 | £90,000 |
| 10 Aug 2018 | £68,390 |
141, Temple Road, Willenhall WV13 1ES
| Today | See what it's worth now |
| 18 Mar 2026 | £100,000 |
| 17 Apr 2007 | £76,000 |
55, Victoria Street, Willenhall WV13 1DR
| Today | See what it's worth now |
| 16 Mar 2026 | £150,000 |
| 29 Sep 2003 | £64,950 |
27, Thompson Close, Willenhall WV13 1ST
| Today | See what it's worth now |
| 6 Mar 2026 | £265,000 |
No other historical records.
30, St Annes Road, Willenhall WV13 1ED
| Today | See what it's worth now |
| 4 Mar 2026 | £115,000 |
| 27 May 2008 | £95,000 |
152, St Annes Road, Willenhall WV13 1DY
| Today | See what it's worth now |
| 26 Jan 2026 | £260,000 |
| 28 Oct 2016 | £189,995 |
No other historical records.
52, Victoria Street, Willenhall WV13 1DR
| Today | See what it's worth now |
| 15 Jan 2026 | £152,000 |
| 20 Jun 2005 | £80,000 |
No other historical records.
27, Regent Street, Willenhall WV13 1DJ
| Today | See what it's worth now |
| 8 Jan 2026 | £154,000 |
| 2 May 2014 | £84,000 |
106, Temple Road, Willenhall WV13 1ES
| Today | See what it's worth now |
| 5 Jan 2026 | £170,000 |
| 6 Oct 2006 | £75,000 |
No other historical records.
1, Stonehouse Avenue, Willenhall WV13 1AP
| Today | See what it's worth now |
| 23 Dec 2025 | £177,000 |
No other historical records.
5, Dingle Lane, Willenhall WV13 1AR
| Today | See what it's worth now |
| 19 Dec 2025 | £380,000 |
| 8 Oct 1999 | £74,000 |
No other historical records.
15, Honeybourne Way, Willenhall WV13 1HN
| Today | See what it's worth now |
| 16 Dec 2025 | £282,000 |
| 26 Mar 2021 | £223,000 |
69, Albion Road, Willenhall WV13 1ND
| Today | See what it's worth now |
| 5 Dec 2025 | £295,000 |
No other historical records.
59, Albion Road, Willenhall WV13 1ND

| Today | See what it's worth now |
| 28 Nov 2025 | £293,000 |
| 25 Jun 2008 | £194,000 |
No other historical records.
10, Stonehouse Avenue, Willenhall WV13 1AP
| Today | See what it's worth now |
| 5 Nov 2025 | £230,000 |
| 19 Jun 2020 | £191,000 |
No other historical records.
180, St Annes Road, Willenhall WV13 1DY
| Today | See what it's worth now |
| 24 Oct 2025 | £169,000 |
| 13 Dec 2022 | £140,000 |
9, Bloom Close, Willenhall WV13 1BF
| Today | See what it's worth now |
| 30 Sep 2025 | £180,500 |
| 18 Nov 2011 | £82,000 |
No other historical records.
17, New Croft Drive, Willenhall WV13 1DZ
| Today | See what it's worth now |
| 26 Sep 2025 | £282,500 |
| 2 Aug 2016 | £189,995 |
No other historical records.
11, Ashburn Grove, Willenhall WV13 1HS
| Today | See what it's worth now |
| 19 Sep 2025 | £247,000 |
| 27 Apr 2011 | £128,000 |
11, Chester Close, Willenhall WV13 1JF

| Today | See what it's worth now |
| 8 Sep 2025 | £250,000 |
| 6 Dec 1995 | £43,000 |
No other historical records.
25, Ravensbourne Grove, Willenhall WV13 1HX
| Today | See what it's worth now |
| 1 Sep 2025 | £171,000 |
| 4 Aug 2000 | £47,000 |
No other historical records.
87, Webster Road, Willenhall WV13 1BL
| Today | See what it's worth now |
| 1 Sep 2025 | £167,000 |
No other historical records.
13, Belinda Close, Willenhall WV13 1BZ
| Today | See what it's worth now |
| 26 Aug 2025 | £275,000 |
| 3 May 2013 | £103,000 |
No other historical records.
Source Acknowledgement: © Crown copyright. England and Wales house price data is publicly available information produced by the HM Land Registry.This material was last updated on 9 July 2026. It covers the period from 1 January 1995 to 30 April 2026 and contains property transactions which have been registered during that period. Contains HM Land Registry data © Crown copyright and database right 2026. This data is licensed under the Open Government Licence v3.0.
Disclaimer: Rightmove.co.uk provides this HM Land Registry data "as is". The burden for fitness of the data relies completely with the user and is provided for informational purposes only. No warranty, express or implied, is given relating to the accuracy of content of the HM Land Registry data and Rightmove does not accept any liability for error or omission. If you have found an error with the data or need further information please contact HM Land Registry.
Permitted Use: Viewers of this Information are granted permission to access this Crown copyright material and to download it onto electronic, magnetic, optical or similar storage media provided that such activities are for private research, study or in-house use only. Any other use of the material requires the formal written permission of Land Registry which can be requested from us, and is subject to an additional licence and associated charge.
Rightmove takes no liability for your use of, or reliance on, Rightmove's Instant Valuation due to the limitations of our tracking tool listed here. Use of this tool is taken entirely at your own risk. All rights reserved.