
House Prices in Queen Street
House prices in Queen Street have an overall average of £715,698 over the last year.
The majority of properties sold in Queen Street during the last year were detached properties, selling for an average price of £771,118. Semi-detached properties sold for an average of £401,650.
Overall, the historical sold prices in Queen Street over the last year were 2% up on the previous year and 27% down on the 2023 peak of £986,866.
Properties Sold
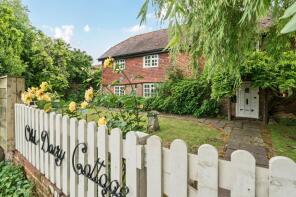
Old Dairy Cottage, Salisbury Road, Fordingbridge SP6 2EB
| Today | See what it's worth now |
| 27 Apr 2026 | £650,000 |
| 22 May 2001 | £247,000 |
No other historical records.
Mi-casa, Stuckton Road, Fordingbridge SP6 2HE
| Today | See what it's worth now |
| 31 Mar 2026 | £700,000 |
| 30 Sep 2016 | £600,000 |
No other historical records.
2, Fishers Heron, Southampton Road, East Mills SP6 2JR
| Today | See what it's worth now |
| 26 Feb 2026 | £465,000 |
No other historical records.
Serenity, The Marsh, Fordingbridge SP6 2EL
| Today | See what it's worth now |
| 7 Jan 2026 | £370,000 |
| 25 Sep 1998 | £85,000 |
No other historical records.
Forge Cottage, Bickton Lane, Fordingbridge SP6 2HA
| Today | See what it's worth now |
| 16 Dec 2025 | £585,000 |
| 7 May 2021 | £450,000 |
No other historical records.
Cherry Tree Cottage, The Marsh, Fordingbridge SP6 2EJ
| Today | See what it's worth now |
| 15 Dec 2025 | £900,000 |
| 20 Nov 2008 | £490,000 |
The Elms, The Marsh, Fordingbridge SP6 2EL

| Today | See what it's worth now |
| 5 Dec 2025 | £369,950 |
| 26 Jun 1997 | £85,000 |
No other historical records.
Long Orchard, Woodgreen Common Road, Fordingbridge SP6 2BQ
| Today | See what it's worth now |
| 5 Dec 2025 | £1,050,000 |
| 8 Sep 2016 | £860,000 |
Westward, High Street, Fordingbridge SP6 2AU
| Today | See what it's worth now |
| 19 Nov 2025 | £575,000 |
| 30 Jul 2004 | £411,000 |
Pipits Hill, Brook Lane, Fordingbridge SP6 2AZ
| Today | See what it's worth now |
| 14 Oct 2025 | £556,000 |
| 25 Jan 2013 | £369,000 |
No other historical records.
Hazeldene, Brook Lane, Fordingbridge SP6 2AZ
| Today | See what it's worth now |
| 2 Oct 2025 | £532,000 |
| 28 Nov 2018 | £470,000 |
Non-go-by, The Common, Fordingbridge SP6 2BB
| Today | See what it's worth now |
| 30 Sep 2025 | £750,000 |
| 20 Oct 1998 | £163,000 |
No other historical records.
Piencourt Cottage, Hern Lane, Fordingbridge SP6 2QQ
| Today | See what it's worth now |
| 25 Sep 2025 | £825,000 |
| 13 Sep 2018 | £630,000 |
Hill Farm, Stuckton Hill, Stuckton SP6 2HG
| Today | See what it's worth now |
| 29 Aug 2025 | £1,330,000 |
No other historical records.
Grey Gables, Road Through South Gorley, Fordingbridge SP6 2PW
| Today | See what it's worth now |
| 29 Aug 2025 | £675,000 |
| 25 Mar 2022 | £630,000 |
No other historical records.
Culverhay, Southampton Road, Fordingbridge SP6 2LG
| Today | See what it's worth now |
| 29 Aug 2025 | £940,000 |
| 28 Jun 2018 | £686,000 |
Cherry Bank, Road From Furze Hill To Ogdens, Fordingbridge SP6 2PZ

| Today | See what it's worth now |
| 28 Aug 2025 | £750,000 |
| 29 Jun 2021 | £660,000 |
Fair Acres Farm, Lawrence Lane, Fordingbridge SP6 2PG
| Today | See what it's worth now |
| 27 Aug 2025 | £1,275,000 |
| 4 Feb 2000 | £290,000 |
Antlers, Road From Hyde Towards Ogdens, Fordingbridge SP6 2QE
| Today | See what it's worth now |
| 13 Aug 2025 | £790,000 |
| 30 Jul 2013 | £480,000 |
Canberra, Hyde Common, Frogham SP6 2HN
| Today | See what it's worth now |
| 8 Aug 2025 | £226,000 |
No other historical records.
Greenlands, Hatchet Green, Hale SP6 2NE
| Today | See what it's worth now |
| 7 Jul 2025 | £606,000 |
No other historical records.
The Old School House, South Gorley SP6 2PP
| Today | See what it's worth now |
| 30 Jun 2025 | £455,000 |
No other historical records.
3, The Cottages, Stuckton Hill, Fordingbridge SP6 2HQ
| Today | See what it's worth now |
| 27 Jun 2025 | £375,000 |
| 4 Apr 2008 | £245,000 |

Source Acknowledgement: © Crown copyright. England and Wales house price data is publicly available information produced by the HM Land Registry.This material was last updated on 9 July 2026. It covers the period from 1 January 1995 to 30 April 2026 and contains property transactions which have been registered during that period. Contains HM Land Registry data © Crown copyright and database right 2026. This data is licensed under the Open Government Licence v3.0.
Disclaimer: Rightmove.co.uk provides this HM Land Registry data "as is". The burden for fitness of the data relies completely with the user and is provided for informational purposes only. No warranty, express or implied, is given relating to the accuracy of content of the HM Land Registry data and Rightmove does not accept any liability for error or omission. If you have found an error with the data or need further information please contact HM Land Registry.
Permitted Use: Viewers of this Information are granted permission to access this Crown copyright material and to download it onto electronic, magnetic, optical or similar storage media provided that such activities are for private research, study or in-house use only. Any other use of the material requires the formal written permission of Land Registry which can be requested from us, and is subject to an additional licence and associated charge.
Rightmove takes no liability for your use of, or reliance on, Rightmove's Instant Valuation due to the limitations of our tracking tool listed here. Use of this tool is taken entirely at your own risk. All rights reserved.