
House Prices in Ranskill
House prices in Ranskill have an overall average of £365,346 over the last year.
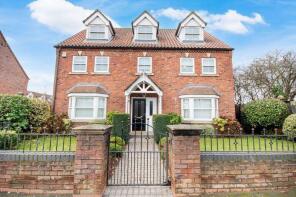
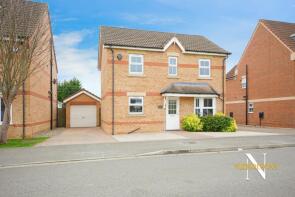
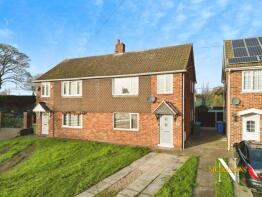
The majority of properties sold in Ranskill during the last year were detached properties, selling for an average price of £438,056. Semi-detached properties sold for an average of £187,333, with terraced properties fetching £245,000.
Overall, the historical sold prices in Ranskill over the last year were 10% up on the previous year and 8% up on the 2021 peak of £338,667.
Properties Sold
36, Cherry Tree Close, Ranskill DN22 8LX
| Today | See what it's worth now |
| 2 Apr 2026 | £175,000 |
No other historical records.
5, Dingle Court, Retford DN22 8FB
| Today | See what it's worth now |
| 27 Mar 2026 | £515,000 |
| 30 Jun 2004 | £345,000 |
No other historical records.
10, Arundel Drive, Retford DN22 8PQ

| Today | See what it's worth now |
| 15 Dec 2025 | £280,000 |
| 30 Jun 2011 | £140,000 |
No other historical records.
6, Arundel Drive, Retford DN22 8PQ
| Today | See what it's worth now |
| 14 Nov 2025 | £190,000 |
| 30 Jan 2004 | £100,000 |
Millbeck, Mattersey Road, Retford DN22 8NF
| Today | See what it's worth now |
| 14 Nov 2025 | £370,000 |
| 1 Oct 2020 | £338,000 |
No other historical records.
3, Juniper Tree Grove, Ranskill DN22 8TJ

| Today | See what it's worth now |
| 29 Oct 2025 | £737,500 |
| 6 Sep 2024 | £710,000 |
No other historical records.
16, Lowfield Close, Retford DN22 8GA
| Today | See what it's worth now |
| 13 Oct 2025 | £285,000 |
| 25 May 2007 | £198,000 |
5, Spinney Mede, Retford DN22 8NB
| Today | See what it's worth now |
| 25 Sep 2025 | £430,000 |
| 20 Nov 2019 | £340,000 |
66, Arundel Drive, Retford DN22 8PQ
| Today | See what it's worth now |
| 29 Aug 2025 | £202,000 |
| 22 Aug 2022 | £180,000 |
No other historical records.
Larkfield House, Blyth Road, Retford DN22 8LR
| Today | See what it's worth now |
| 29 Aug 2025 | £810,000 |
| 8 Oct 2021 | £885,000 |
13, Whitton Close, Retford DN22 8PD
| Today | See what it's worth now |
| 8 Aug 2025 | £185,000 |
| 6 Apr 2001 | £64,000 |
No other historical records.
15, Station Road, Retford DN22 8LE
| Today | See what it's worth now |
| 25 Jul 2025 | £245,000 |
| 25 Aug 2022 | £185,000 |
21, Southfall Close, Retford DN22 8NE
| Today | See what it's worth now |
| 17 Jul 2025 | £325,000 |
| 5 Dec 2014 | £187,000 |
No other historical records.
30, Cherry Tree Close, Retford DN22 8LX
| Today | See what it's worth now |
| 19 Jun 2025 | £145,000 |
| 15 Mar 2024 | £82,000 |
2, Maple Tree Wood, Ranskill DN22 8TH
| Today | See what it's worth now |
| 16 Jun 2025 | £500,000 |
No other historical records.
Alvor, Folly Nook Lane, Ranskill DN22 8NQ
| Today | See what it's worth now |
| 23 May 2025 | £300,000 |
| 30 Oct 2017 | £196,000 |
No other historical records.
4, Hazel Tree Mews, Ranskill DN22 8TL
| Today | See what it's worth now |
| 20 May 2025 | £590,000 |
No other historical records.
Staffa, Great North Road, Retford DN22 8NJ
| Today | See what it's worth now |
| 19 May 2025 | £275,000 |
| 11 Feb 2005 | £165,000 |
No other historical records.
5, Blue Bell Court, Retford DN22 8GB
| Today | See what it's worth now |
| 8 May 2025 | £430,000 |
| 27 Mar 2020 | £325,000 |
10, Yew Tree Close, Ranskill DN22 8TN
| Today | See what it's worth now |
| 30 Apr 2025 | £212,222 |
| 18 Aug 2023 | £213,600 |
No other historical records.
15, Willow Avenue, Retford DN22 8LB
| Today | See what it's worth now |
| 28 Apr 2025 | £258,000 |
| 13 Dec 2007 | £186,995 |
No other historical records.
61, Station Avenue, Retford DN22 8LQ
| Today | See what it's worth now |
| 25 Apr 2025 | £170,000 |
| 29 Nov 2019 | £128,000 |
No other historical records.
3, Maple Tree Wood, Ranskill DN22 8TH
| Today | See what it's worth now |
| 28 Mar 2025 | £520,000 |
No other historical records.

Source Acknowledgement: © Crown copyright. England and Wales house price data is publicly available information produced by the HM Land Registry.This material was last updated on 9 July 2026. It covers the period from 1 January 1995 to 30 April 2026 and contains property transactions which have been registered during that period. Contains HM Land Registry data © Crown copyright and database right 2026. This data is licensed under the Open Government Licence v3.0.
Disclaimer: Rightmove.co.uk provides this HM Land Registry data "as is". The burden for fitness of the data relies completely with the user and is provided for informational purposes only. No warranty, express or implied, is given relating to the accuracy of content of the HM Land Registry data and Rightmove does not accept any liability for error or omission. If you have found an error with the data or need further information please contact HM Land Registry.
Permitted Use: Viewers of this Information are granted permission to access this Crown copyright material and to download it onto electronic, magnetic, optical or similar storage media provided that such activities are for private research, study or in-house use only. Any other use of the material requires the formal written permission of Land Registry which can be requested from us, and is subject to an additional licence and associated charge.
Rightmove takes no liability for your use of, or reliance on, Rightmove's Instant Valuation due to the limitations of our tracking tool listed here. Use of this tool is taken entirely at your own risk. All rights reserved.