
House Prices in Rathmere
House prices in Rathmere have an overall average of £408,589 over the last year.
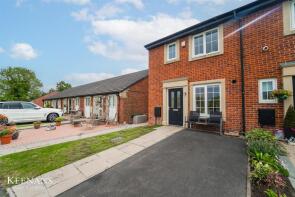
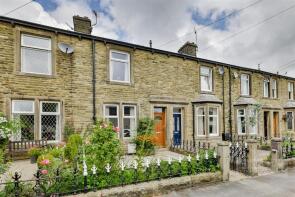
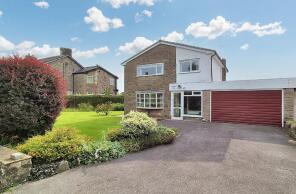
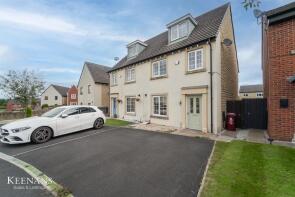
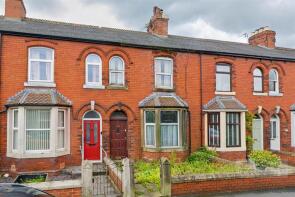
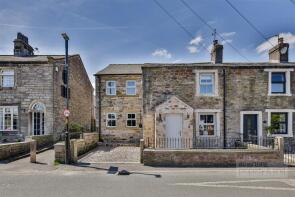
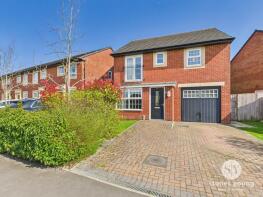
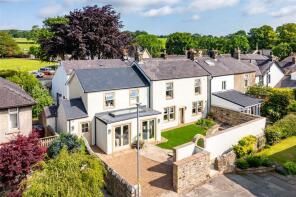
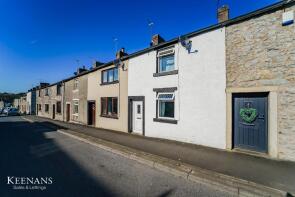
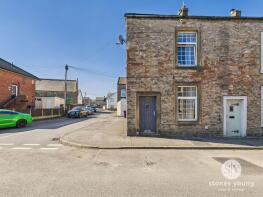
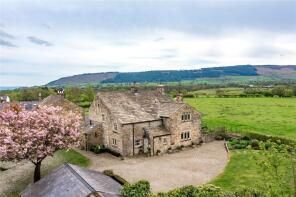
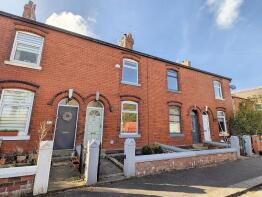
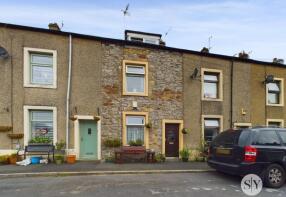
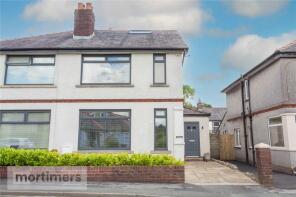
The majority of properties sold in Rathmere during the last year were terraced properties, selling for an average price of £274,571. Detached properties sold for an average of £766,429, with semi-detached properties fetching £351,917.
Overall, the historical sold prices in Rathmere over the last year were 10% up on the previous year and 3% up on the 2022 peak of £398,532.
Properties Sold
28, Ribble Prospect, Clitheroe BB7 2FE
| Today | See what it's worth now |
| 17 Apr 2026 | £165,000 |
| 4 Aug 2017 | £119,000 |
No other historical records.
Marl Hill House, Cow Ark Road, Clitheroe BB7 3DH

| Today | See what it's worth now |
| 2 Apr 2026 | £810,000 |
| 2 Oct 2000 | £250,000 |
No other historical records.
38, Waddow View, Waddington BB7 3HJ
| Today | See what it's worth now |
| 13 Feb 2026 | £215,000 |
No other historical records.
47, West View, Clitheroe Road, Clitheroe BB7 3HW

| Today | See what it's worth now |
| 9 Feb 2026 | £385,000 |
| 22 Nov 2004 | £211,500 |
Hunters Gate, West Bradford Road, Waddington BB7 3JE
| Today | See what it's worth now |
| 6 Feb 2026 | £435,000 |
No other historical records.
3, Irwell Mews, Clitheroe BB7 2FR
| Today | See what it's worth now |
| 18 Dec 2025 | £250,000 |
| 1 Jun 2022 | £270,000 |
23, St Pauls Street, Clitheroe BB7 2LS
| Today | See what it's worth now |
| 17 Dec 2025 | £135,000 |
No other historical records.
11, Spring Gardens, Clitheroe Road, Clitheroe BB7 3HH
| Today | See what it's worth now |
| 16 Dec 2025 | £575,000 |
| 16 Apr 2024 | £540,000 |
25, St Pauls Street, Clitheroe BB7 2LS
| Today | See what it's worth now |
| 20 Nov 2025 | £217,500 |
| 17 Mar 2021 | £158,000 |
No other historical records.
Pages Barn, Wood House Lane, Clitheroe BB7 3AH

| Today | See what it's worth now |
| 19 Nov 2025 | £355,000 |
| 22 Dec 2003 | £367,500 |
No other historical records.
14, Ribble Prospect, Clitheroe BB7 2FE
| Today | See what it's worth now |
| 17 Nov 2025 | £325,000 |
| 25 Nov 2016 | £256,995 |
No other historical records.
90, Regent Street, Waddington BB7 3JA
| Today | See what it's worth now |
| 31 Oct 2025 | £622,000 |
No other historical records.
108, St Pauls Street, Clitheroe BB7 2LS
| Today | See what it's worth now |
| 27 Oct 2025 | £160,000 |
| 19 Aug 2005 | £114,000 |
No other historical records.
23, Nelson Street, Clitheroe BB7 2NQ

| Today | See what it's worth now |
| 27 Oct 2025 | £205,000 |
| 15 May 2002 | £54,000 |
No other historical records.
34, Union Street, Clitheroe BB7 2NH
| Today | See what it's worth now |
| 24 Oct 2025 | £187,000 |
| 29 Aug 2023 | £169,950 |
Lees House Farm, Whitewell Road, Cow Ark, Clitheroe BB7 3DG
| Today | See what it's worth now |
| 24 Oct 2025 | £1,220,000 |
| 17 Mar 2005 | £625,000 |
15, Riverside, Clitheroe BB7 2NP
| Today | See what it's worth now |
| 17 Oct 2025 | £220,000 |
| 11 Dec 2015 | £164,950 |
No other historical records.
Beechthorpe, Belle Vue Lane, Clitheroe BB7 3HY
| Today | See what it's worth now |
| 15 Sep 2025 | £1,530,000 |
| 15 May 2019 | £720,000 |
No other historical records.
97c Mews Cottage, Beech Mount, Clitheroe BB7 3HS
| Today | See what it's worth now |
| 8 Sep 2025 | £287,500 |
| 9 Jul 2024 | £276,500 |
Plum Tree Cottage, Orchard Cottages, Branch Road, Waddington BB7 3HR
| Today | See what it's worth now |
| 28 Aug 2025 | £600,000 |
| 28 Jan 2022 | £500,000 |
No other historical records.
6, St Pauls Terrace, Clitheroe BB7 2LZ
| Today | See what it's worth now |
| 22 Aug 2025 | £180,000 |
| 30 Apr 2021 | £169,950 |
28, Nelson Street, Clitheroe BB7 2NQ
| Today | See what it's worth now |
| 22 Aug 2025 | £165,000 |
No other historical records.
6, Cornmill Court, Clitheroe BB7 3HB
| Today | See what it's worth now |
| 13 Aug 2025 | £120,000 |
| 29 Mar 2021 | £102,000 |
No other historical records.

Source Acknowledgement: © Crown copyright. England and Wales house price data is publicly available information produced by the HM Land Registry.This material was last updated on 9 July 2026. It covers the period from 1 January 1995 to 30 April 2026 and contains property transactions which have been registered during that period. Contains HM Land Registry data © Crown copyright and database right 2026. This data is licensed under the Open Government Licence v3.0.
Disclaimer: Rightmove.co.uk provides this HM Land Registry data "as is". The burden for fitness of the data relies completely with the user and is provided for informational purposes only. No warranty, express or implied, is given relating to the accuracy of content of the HM Land Registry data and Rightmove does not accept any liability for error or omission. If you have found an error with the data or need further information please contact HM Land Registry.
Permitted Use: Viewers of this Information are granted permission to access this Crown copyright material and to download it onto electronic, magnetic, optical or similar storage media provided that such activities are for private research, study or in-house use only. Any other use of the material requires the formal written permission of Land Registry which can be requested from us, and is subject to an additional licence and associated charge.
Rightmove takes no liability for your use of, or reliance on, Rightmove's Instant Valuation due to the limitations of our tracking tool listed here. Use of this tool is taken entirely at your own risk. All rights reserved.