
House Prices in Redcar
House prices in Redcar have an overall average of £175,933 over the last year.
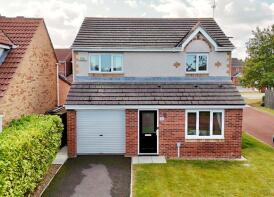
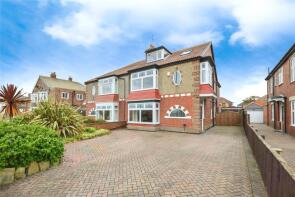
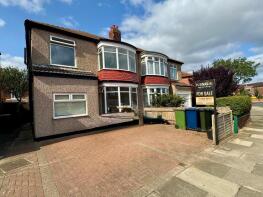
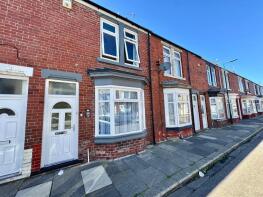
The majority of properties sold in Redcar during the last year were semi-detached properties, selling for an average price of £170,686. Terraced properties sold for an average of £122,383, with detached properties fetching £261,506.
Overall, the historical sold prices in Redcar over the last year were 1% down on the previous year and 5% up on the 2022 peak of £167,802.
Properties Sold
43, Holyhead Drive, Redcar TS10 2QS
| Today | See what it's worth now |
| 23 Apr 2026 | £195,000 |
| 29 Apr 2022 | £180,000 |
45, Ripon Road, Redcar TS10 3QH
| Today | See what it's worth now |
| 9 Apr 2026 | £132,000 |
| 8 Dec 2011 | £87,000 |
No other historical records.
33, Gosforth Avenue, Redcar TS10 3LL
| Today | See what it's worth now |
| 8 Apr 2026 | £145,000 |
| 18 Jul 2008 | £97,500 |
No other historical records.
4, Lovat Avenue, Dormanstown, Redcar TS10 5BS
| Today | See what it's worth now |
| 2 Apr 2026 | £158,000 |
| 27 Sep 1996 | £55,000 |
No other historical records.
2, Shoreham Close, Redcar TS10 2RD

| Today | See what it's worth now |
| 2 Apr 2026 | £230,000 |
| 17 Oct 2023 | £224,950 |
4, Beadnell Way, Redcar TS10 2QU
| Today | See what it's worth now |
| 2 Apr 2026 | £389,950 |
| 23 Feb 2018 | £260,000 |
78, Troutbeck Road, Redcar TS10 1NQ
| Today | See what it's worth now |
| 1 Apr 2026 | £148,000 |
| 21 Oct 2002 | £45,000 |
No other historical records.
3, Deepdene Grove, Redcar TS10 2ST
| Today | See what it's worth now |
| 1 Apr 2026 | £360,000 |
| 25 Jun 2025 | £327,000 |
10, Eskdale Road, Dormanstown, Redcar TS10 5HA
| Today | See what it's worth now |
| 1 Apr 2026 | £152,000 |
| 22 Oct 2021 | £139,950 |
6, Wincanton Road, Redcar TS10 2HP
| Today | See what it's worth now |
| 31 Mar 2026 | £200,000 |
No other historical records.
21, Oxendale Road, Redcar TS10 4FH
| Today | See what it's worth now |
| 30 Mar 2026 | £181,000 |
| 16 Sep 2021 | £153,000 |
16, Brooksbank Avenue, Redcar TS10 1HS
| Today | See what it's worth now |
| 30 Mar 2026 | £143,500 |
| 9 Nov 2010 | £87,000 |
40, Cherry Trees, Coatham Road, Redcar TS10 1RP
| Today | See what it's worth now |
| 26 Mar 2026 | £42,000 |
| 24 Aug 2006 | £73,000 |
No other historical records.
2, Juniper Close, Redcar TS10 2UD
| Today | See what it's worth now |
| 25 Mar 2026 | £260,000 |
| 28 Nov 2003 | £145,000 |
18, Cochrane Gardens, Redcar TS10 2QA

| Today | See what it's worth now |
| 25 Mar 2026 | £156,000 |
| 20 May 2022 | £157,500 |
41, Coast Road, Redcar TS10 3NN
| Today | See what it's worth now |
| 20 Mar 2026 | £475,000 |
| 1 Aug 2018 | £310,000 |
No other historical records.
100, Oak Road, Redcar TS10 3RG
| Today | See what it's worth now |
| 20 Mar 2026 | £156,000 |
| 1 Nov 2013 | £108,000 |
34, Charlotte Street, Redcar TS10 3HT
| Today | See what it's worth now |
| 20 Mar 2026 | £90,000 |
| 21 Jun 2006 | £83,000 |
2, Hayburn Close, Redcar TS10 2PZ
| Today | See what it's worth now |
| 20 Mar 2026 | £375,000 |
| 31 Oct 2013 | £226,000 |
No other historical records.
32, Zetland Road, Redcar TS10 3QD
| Today | See what it's worth now |
| 20 Mar 2026 | £170,000 |
| 17 May 2024 | £160,000 |
84, Sandringham Road, Redcar TS10 1ES
| Today | See what it's worth now |
| 20 Mar 2026 | £140,000 |
| 25 Aug 2001 | £47,000 |
No other historical records.
77, Cowslip Drive, Redcar TS10 5BF

| Today | See what it's worth now |
| 19 Mar 2026 | £195,000 |
| 30 Jul 2021 | £204,995 |
No other historical records.
6, Skerries Crescent, Redcar TS10 4SH
| Today | See what it's worth now |
| 18 Mar 2026 | £140,000 |
| 16 Nov 2018 | £115,000 |
Source Acknowledgement: © Crown copyright. England and Wales house price data is publicly available information produced by the HM Land Registry.This material was last updated on 9 July 2026. It covers the period from 1 January 1995 to 30 April 2026 and contains property transactions which have been registered during that period. Contains HM Land Registry data © Crown copyright and database right 2026. This data is licensed under the Open Government Licence v3.0.
Disclaimer: Rightmove.co.uk provides this HM Land Registry data "as is". The burden for fitness of the data relies completely with the user and is provided for informational purposes only. No warranty, express or implied, is given relating to the accuracy of content of the HM Land Registry data and Rightmove does not accept any liability for error or omission. If you have found an error with the data or need further information please contact HM Land Registry.
Permitted Use: Viewers of this Information are granted permission to access this Crown copyright material and to download it onto electronic, magnetic, optical or similar storage media provided that such activities are for private research, study or in-house use only. Any other use of the material requires the formal written permission of Land Registry which can be requested from us, and is subject to an additional licence and associated charge.
Rightmove takes no liability for your use of, or reliance on, Rightmove's Instant Valuation due to the limitations of our tracking tool listed here. Use of this tool is taken entirely at your own risk. All rights reserved.