
House Prices in Renfrew
House prices in Renfrew have an overall average of £179,479 over the last year.
The majority of properties sold in Renfrew during the last year were flats, selling for an average price of £114,442. Terraced properties sold for an average of £186,242, with semi-detached properties fetching £226,608.
Overall, the historical sold prices in Renfrew over the last year were 6% up on the previous year and 13% up on the 2023 peak of £158,855.
Properties Sold
38, Sand Inch Drive, Renfrew PA4 8GB

| Today | See what it's worth now |
| 30 Dec 2025 | £255,995 |
No other historical records.
Flat 1/2, 160, Paisley Road, Renfrew PA4 8DA
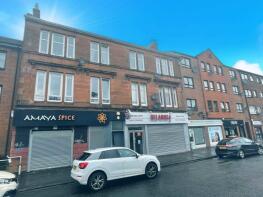
| Today | See what it's worth now |
| 24 Dec 2025 | £66,000 |
| 20 May 2015 | £30,100 |
No other historical records.
34, Osbert Wynd, Renfrew PA4 8GD

| Today | See what it's worth now |
| 24 Dec 2025 | £256,995 |
| 2 Nov 2022 | £359,995 |
No other historical records.
Flat 2/1, 3, Kenley Road, Renfrew PA4 8FE
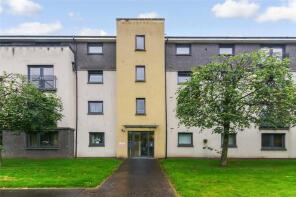
| Today | See what it's worth now |
| 24 Dec 2025 | £150,000 |
| 21 Jan 2019 | £125,000 |
74, Bleasdale Road, Renfrew PA4 8ZT

| Today | See what it's worth now |
| 24 Dec 2025 | £284,777 |
| 9 Sep 2015 | £171,995 |
No other historical records.
39, Sandy Road, Renfrew PA4 0AA
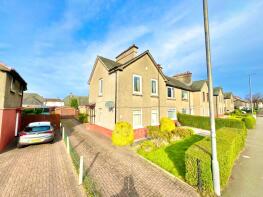
| Today | See what it's worth now |
| 23 Dec 2025 | £182,500 |
No other historical records.
Flat 0/2, 14, Whimbrel Wynd, Renfrew PA4 8TJ
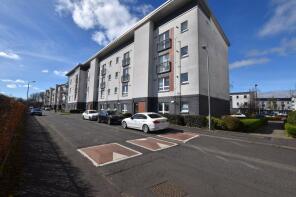
| Today | See what it's worth now |
| 22 Dec 2025 | £128,000 |
| 26 Aug 2019 | £104,000 |
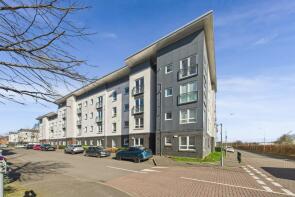
Flat 0/1, 10, Whimbrel Wynd, Renfrew PA4 8TJ
| Today | See what it's worth now |
| 22 Dec 2025 | £126,000 |
| 28 Jan 2009 | £137,500 |
No other historical records.
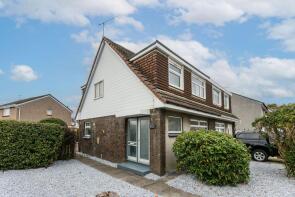
9, Tweed Crescent, Renfrew PA4 0UF
| Today | See what it's worth now |
| 22 Dec 2025 | £243,000 |
No other historical records.
9, Clydeside Terrace, Renfrew PA4 8GF

| Today | See what it's worth now |
| 22 Dec 2025 | £291,995 |
No other historical records.
2, Cruachan Avenue, Renfrew PA4 0PH

| Today | See what it's worth now |
| 19 Dec 2025 | £143,500 |
| 26 Apr 2013 | £90,000 |
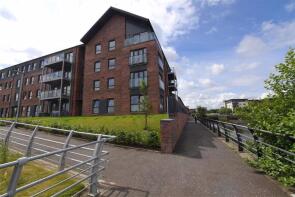
Flat 0/2, 27, Fingal Avenue, Renfrew PA4 8FT
| Today | See what it's worth now |
| 19 Dec 2025 | £175,000 |
| 1 Oct 2020 | £155,000 |
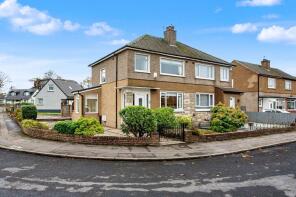
1, Fereneze Avenue, Renfrew PA4 0QU
| Today | See what it's worth now |
| 19 Dec 2025 | £242,650 |
No other historical records.
Flat 2/1, 21, Redshank Avenue, Renfrew PA4 8SG
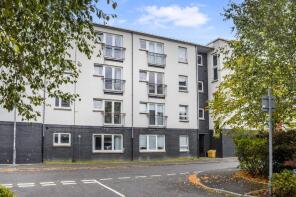
| Today | See what it's worth now |
| 19 Dec 2025 | £142,500 |
| 19 Jan 2007 | £123,250 |
No other historical records.
34, Craigielea Park, Renfrew PA4 8HP
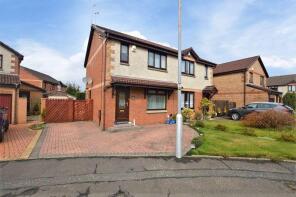
| Today | See what it's worth now |
| 19 Dec 2025 | £210,000 |
| 11 Jun 2020 | £185,000 |
28, Osbert Wynd, Renfrew PA4 8GD

| Today | See what it's worth now |
| 19 Dec 2025 | £220,995 |
| 16 Dec 2022 | £409,995 |
No other historical records.
36e, Vanguard Way, Renfrew PA4 0LP

| Today | See what it's worth now |
| 19 Dec 2025 | £39,995 |
| 19 Aug 2005 | £54,250 |
No other historical records.
4, Cruachan Avenue, Renfrew PA4 0PH
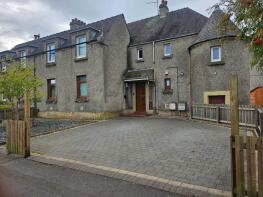
| Today | See what it's worth now |
| 19 Dec 2025 | £143,500 |
| 20 Sep 2016 | £90,000 |
5, Lancaster Way, Renfrew PA4 0EW
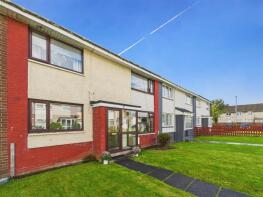
| Today | See what it's worth now |
| 18 Dec 2025 | £170,000 |
| 18 Oct 2006 | £115,000 |
No other historical records.
11, Moidart Avenue, Renfrew PA4 9BT

| Today | See what it's worth now |
| 18 Dec 2025 | £115,000 |
| 23 Jul 2004 | £18,800 |
No other historical records.
4, Laggan Terrace, Renfrew PA4 9DW
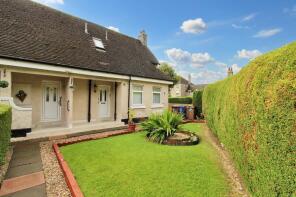
| Today | See what it's worth now |
| 18 Dec 2025 | £112,387 |
No other historical records.
Flat 3/1, 10, Fingal Road, Renfrew PA4 8FH
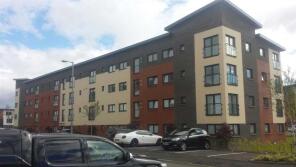
| Today | See what it's worth now |
| 17 Dec 2025 | £160,000 |
| 25 Sep 2020 | £130,000 |
Flat 1/2, 7, Paisley Road, Renfrew PA4 8JH

| Today | See what it's worth now |
| 17 Dec 2025 | £58,500 |
| 24 Jun 2022 | £65,000 |
No other historical records.
Flat 2/1, 1, Lawers Road, Renfrew PA4 0PQ

| Today | See what it's worth now |
| 17 Dec 2025 | £85,258 |
No other historical records.
6, Cassley Avenue, Renfrew PA4 0YQ
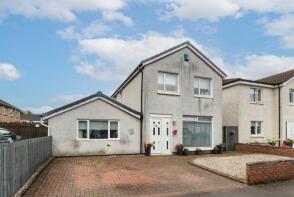
| Today | See what it's worth now |
| 17 Dec 2025 | £308,000 |
No other historical records.
Source Acknowledgement: © Crown copyright. Scottish house price data is publicly available information produced by the Registers of Scotland. Material has been reproduced with the permission of the Keeper of the Registers of Scotland and contains data compiled by Registers of Scotland. For further information, please contact data@ros.gov.uk. Please note the dates shown here relate to the property's registered date not sold date.This material was last updated on 4 February 2026. It covers the period from 8 December 1987 to 31 December 2025 and contains property transactions which have been registered during that period.
Disclaimer: Rightmove.co.uk provides this Registers of Scotland data "as is". The burden for fitness of the data relies completely with the user and is provided for informational purposes only. No warranty, express or implied, is given relating to the accuracy of content of the Registers of Scotland data and Rightmove plc does not accept any liability for error or omission. If you have found an error with the data or need further information please contact data@ros.gov.uk
Permitted Use: The Registers of Scotland allows the reproduction of the data which it provides to Rightmove.co.uk free of charge in any format or medium only for research, private study or for internal circulation within an organisation. This is subject to it being reproduced accurately and not used in a misleading context. The material must be acknowledged as Crown Copyright. You are not allowed to use this information for commercial purposes, nor must you copy, distribute, sell or publish the data in any way. For any other use of this material, please apply to the Registers of Scotland for a licence. You can do this online at www.ros.gov.uk, by email at data@ros.gov.uk or by writing to Business Development, Registers of Scotland, Meadowbank House, 153 London Road, Edinburgh EH8 7AU.
Map data ©OpenStreetMap contributors.
Rightmove takes no liability for your use of, or reliance on, Rightmove's Instant Valuation due to the limitations of our tracking tool listed here. Use of this tool is taken entirely at your own risk. All rights reserved.
