
House Prices in Ribbleton
House prices in Ribbleton have an overall average of £157,043 over the last year.
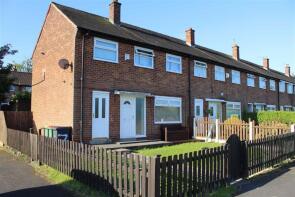
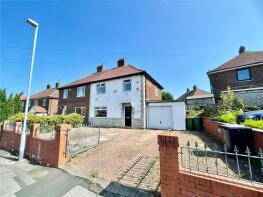
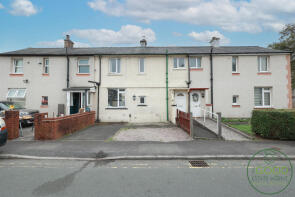
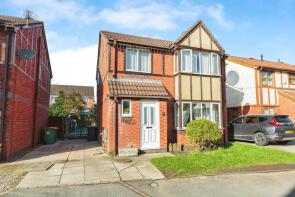
The majority of properties sold in Ribbleton during the last year were terraced properties, selling for an average price of £129,732. Semi-detached properties sold for an average of £169,312, with detached properties fetching £309,545.
Overall, the historical sold prices in Ribbleton over the last year were 11% up on the previous year and 18% up on the 2022 peak of £133,513.
Properties Sold
6, Oban Crescent, Preston PR1 6ET

| Today | See what it's worth now |
| 20 Apr 2026 | £127,000 |
| 28 May 2010 | £130,000 |
3, Kingsmuir Avenue, Fulwood, Preston PR2 6AG
| Today | See what it's worth now |
| 17 Apr 2026 | £435,000 |
No other historical records.
6, Stuart Road, Preston PR2 6AD
| Today | See what it's worth now |
| 10 Apr 2026 | £350,000 |
| 1 Mar 2002 | £97,500 |
No other historical records.
50, Sulby Drive, Preston PR2 6RU
| Today | See what it's worth now |
| 10 Apr 2026 | £60,000 |
| 16 May 2005 | £17,080 |
No other historical records.
151, Skeffington Road, Preston PR1 5HD
| Today | See what it's worth now |
| 9 Apr 2026 | £91,500 |
| 27 Aug 2009 | £60,000 |
8, Grizedale Place, Preston PR2 6JU
| Today | See what it's worth now |
| 9 Apr 2026 | £185,000 |
| 9 Apr 2025 | £93,000 |
15, Burholme Place, Preston PR2 6HR

| Today | See what it's worth now |
| 8 Apr 2026 | £160,000 |
| 6 Apr 2018 | £120,000 |
3, Stuart Road, Preston PR2 6AD
| Today | See what it's worth now |
| 27 Mar 2026 | £336,000 |
| 27 Sep 2022 | £336,000 |
4, Park Close, Preston PR2 6YW
| Today | See what it's worth now |
| 27 Mar 2026 | £347,000 |
| 2 Jun 2003 | £173,950 |
No other historical records.
6, Ribbleton Hall Drive, Preston PR2 6EE
| Today | See what it's worth now |
| 26 Mar 2026 | £180,000 |
| 21 Sep 2001 | £60,000 |
No other historical records.
4, Illingworth Road, Preston PR1 4TU
| Today | See what it's worth now |
| 25 Mar 2026 | £127,500 |
| 26 Jul 2019 | £68,000 |
3, Conway House, Samuel Street, Preston PR1 4YJ
| Today | See what it's worth now |
| 20 Mar 2026 | £31,000 |
| 21 Jul 2000 | £9,000 |
No other historical records.
32, Hamilton Road, Preston PR2 6YH
| Today | See what it's worth now |
| 20 Mar 2026 | £220,000 |
| 30 Aug 2019 | £160,000 |
2, Sherborne Lodge, Grange Avenue, Preston PR2 6PF
| Today | See what it's worth now |
| 19 Mar 2026 | £36,000 |
| 21 May 2019 | £17,000 |
5, Ellerbeck Avenue, Preston PR2 6XL
| Today | See what it's worth now |
| 17 Mar 2026 | £130,000 |
| 15 Dec 2016 | £82,000 |
7, Wensley Place, Preston PR2 6UT
| Today | See what it's worth now |
| 13 Mar 2026 | £125,000 |
| 24 Mar 2017 | £89,000 |
2, Assheton Place, Preston PR2 6YN
| Today | See what it's worth now |
| 13 Mar 2026 | £160,000 |
| 14 Aug 2019 | £134,000 |
No other historical records.
3, Morris Road, Ribbleton, Preston PR2 6BQ
| Today | See what it's worth now |
| 13 Mar 2026 | £160,000 |
No other historical records.
14, Otters Close, Preston PR2 6NG
| Today | See what it's worth now |
| 11 Mar 2026 | £190,000 |
| 10 Mar 2006 | £142,000 |
No other historical records.
21, Gaythorne Avenue, Preston PR1 5SY
| Today | See what it's worth now |
| 10 Mar 2026 | £221,000 |
| 10 Jan 2020 | £175,000 |
17, Thornfield Avenue, Preston PR2 6NE

| Today | See what it's worth now |
| 9 Mar 2026 | £165,000 |
| 3 Aug 2018 | £110,000 |
No other historical records.
63, Ramsey Avenue, Preston PR1 6EN

| Today | See what it's worth now |
| 27 Feb 2026 | £220,000 |
| 15 Feb 2019 | £150,000 |
No other historical records.
40, Raikes Road, Preston PR1 5EQ
| Today | See what it's worth now |
| 24 Feb 2026 | £137,500 |
No other historical records.
Source Acknowledgement: © Crown copyright. England and Wales house price data is publicly available information produced by the HM Land Registry.This material was last updated on 9 July 2026. It covers the period from 1 January 1995 to 30 April 2026 and contains property transactions which have been registered during that period. Contains HM Land Registry data © Crown copyright and database right 2026. This data is licensed under the Open Government Licence v3.0.
Disclaimer: Rightmove.co.uk provides this HM Land Registry data "as is". The burden for fitness of the data relies completely with the user and is provided for informational purposes only. No warranty, express or implied, is given relating to the accuracy of content of the HM Land Registry data and Rightmove does not accept any liability for error or omission. If you have found an error with the data or need further information please contact HM Land Registry.
Permitted Use: Viewers of this Information are granted permission to access this Crown copyright material and to download it onto electronic, magnetic, optical or similar storage media provided that such activities are for private research, study or in-house use only. Any other use of the material requires the formal written permission of Land Registry which can be requested from us, and is subject to an additional licence and associated charge.
Rightmove takes no liability for your use of, or reliance on, Rightmove's Instant Valuation due to the limitations of our tracking tool listed here. Use of this tool is taken entirely at your own risk. All rights reserved.