
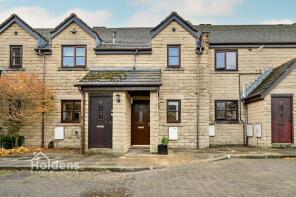
House Prices in Ribchester
House prices in Ribchester have an overall average of £288,000 over the last year.
The majority of properties sold in Ribchester during the last year were terraced properties, selling for an average price of £182,500. Detached properties sold for an average of £400,000, with semi-detached properties fetching £550,000.
Overall, the historical sold prices in Ribchester over the last year were 3% down on the previous year and 30% down on the 2022 peak of £412,556.
Properties Sold
26, Sarmatian Fold, Preston PR3 3YG
| Today | See what it's worth now |
| 14 Apr 2026 | £125,000 |
| 21 Mar 2014 | £102,500 |
1a, Greenside, Preston PR3 3ZJ
| Today | See what it's worth now |
| 23 Mar 2026 | £155,000 |
| 21 Jun 1996 | £49,000 |
No other historical records.
6, Blackburn Road, Preston PR3 3YP
| Today | See what it's worth now |
| 19 Mar 2026 | £400,000 |
| 19 Jan 2010 | £413,500 |
2, Church Street, Preston PR3 3XP
| Today | See what it's worth now |
| 30 Sep 2025 | £550,000 |
| 14 Jun 2021 | £430,020 |
10, Preston Road, Preston PR3 3XL

| Today | See what it's worth now |
| 26 Sep 2025 | £210,000 |
| 7 Mar 2003 | £59,950 |
Somerville, Ribchester Road, Preston PR3 3YA
| Today | See what it's worth now |
| 16 Jun 2025 | £225,000 |
| 10 Sep 1999 | £75,000 |
No other historical records.
12, Sunnyside Avenue, Ribchester PR3 3ZE
| Today | See what it's worth now |
| 13 Jun 2025 | £210,000 |
No other historical records.
23, Asturian Gate, Preston PR3 3XQ
| Today | See what it's worth now |
| 23 May 2025 | £550,000 |
| 13 May 2021 | £495,000 |
Silverstone, Stoneygate Lane, Preston PR3 3YN
| Today | See what it's worth now |
| 16 May 2025 | £325,000 |
| 15 Dec 2000 | £80,000 |
No other historical records.
36, Chesterbrook, Preston PR3 3XT

| Today | See what it's worth now |
| 2 May 2025 | £380,000 |
| 21 May 2018 | £185,000 |
No other historical records.
5, Eastgate, Ribchester PR3 3ZN
| Today | See what it's worth now |
| 31 Mar 2025 | £205,000 |
No other historical records.
13, Water Street, Preston PR3 3YJ
| Today | See what it's worth now |
| 28 Mar 2025 | £212,500 |
| 18 Oct 2019 | £100,000 |
No other historical records.
1, Orchard Close, Fort Avenue, Ribchester PR3 3YS
| Today | See what it's worth now |
| 24 Mar 2025 | £299,950 |
No other historical records.
Ribblesdale View, Greenside, Preston PR3 3ZJ
| Today | See what it's worth now |
| 19 Mar 2025 | £475,000 |
| 31 May 2013 | £410,000 |
No other historical records.
Dale Hey Bungalow, Preston Road, Preston PR3 3XL

| Today | See what it's worth now |
| 26 Feb 2025 | £400,000 |
| 29 Jun 2010 | £207,000 |
No other historical records.
Flat 3, 32, Asturian Gate, Preston PR3 3XQ

| Today | See what it's worth now |
| 11 Feb 2025 | £323,000 |
| 23 Sep 2020 | £345,000 |
42, Blackburn Road, Preston PR3 3YP

| Today | See what it's worth now |
| 31 Jan 2025 | £185,000 |
| 2 Oct 2017 | £146,500 |
57, Church Street, Preston PR3 3YE
| Today | See what it's worth now |
| 24 Jan 2025 | £126,000 |
| 16 Sep 2011 | £105,000 |
No other historical records.
Page House, White Carr Lane, Dilworth Bottoms, Preston PR3 3ZB

| Today | See what it's worth now |
| 4 Dec 2024 | £745,000 |
| 6 Dec 2021 | £640,000 |
7, Chesterbrook, Preston PR3 3XT
| Today | See what it's worth now |
| 4 Dec 2024 | £330,000 |
| 6 Oct 1999 | £59,500 |
No other historical records.
60, Chesterbrook, Preston PR3 3XT

| Today | See what it's worth now |
| 28 Nov 2024 | £419,950 |
| 4 Sep 2003 | £225,000 |
29, Sarmatian Fold, Preston PR3 3YG
| Today | See what it's worth now |
| 1 Nov 2024 | £97,000 |
| 12 Jan 2006 | £107,000 |
8, Chesterbrook, Ribchester PR3 3XT
| Today | See what it's worth now |
| 28 Oct 2024 | £210,000 |
No other historical records.
Source Acknowledgement: © Crown copyright. England and Wales house price data is publicly available information produced by the HM Land Registry.This material was last updated on 9 July 2026. It covers the period from 1 January 1995 to 30 April 2026 and contains property transactions which have been registered during that period. Contains HM Land Registry data © Crown copyright and database right 2026. This data is licensed under the Open Government Licence v3.0.
Disclaimer: Rightmove.co.uk provides this HM Land Registry data "as is". The burden for fitness of the data relies completely with the user and is provided for informational purposes only. No warranty, express or implied, is given relating to the accuracy of content of the HM Land Registry data and Rightmove does not accept any liability for error or omission. If you have found an error with the data or need further information please contact HM Land Registry.
Permitted Use: Viewers of this Information are granted permission to access this Crown copyright material and to download it onto electronic, magnetic, optical or similar storage media provided that such activities are for private research, study or in-house use only. Any other use of the material requires the formal written permission of Land Registry which can be requested from us, and is subject to an additional licence and associated charge.
Rightmove takes no liability for your use of, or reliance on, Rightmove's Instant Valuation due to the limitations of our tracking tool listed here. Use of this tool is taken entirely at your own risk. All rights reserved.