
House Prices in Riddings
House prices in Riddings have an overall average of £172,093 over the last year.
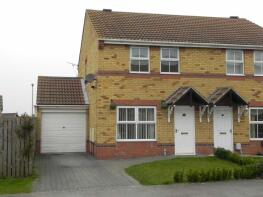
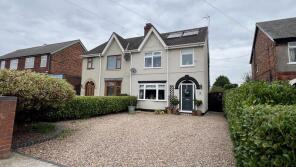
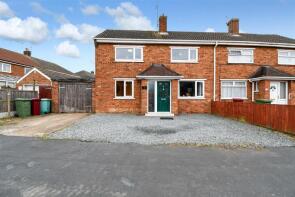
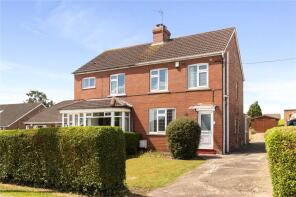
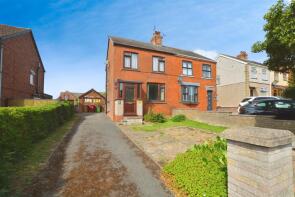
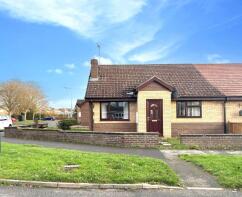
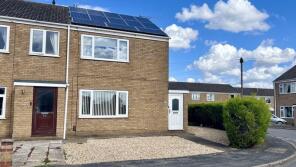
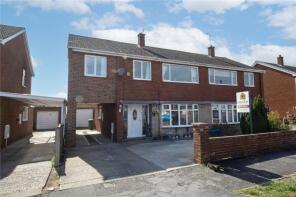
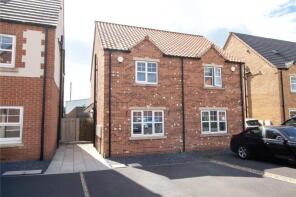
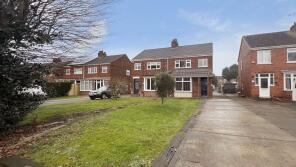
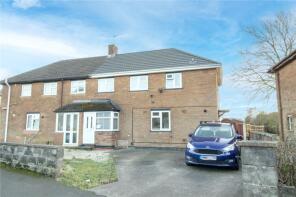
The majority of properties sold in Riddings during the last year were semi-detached properties, selling for an average price of £156,715. Detached properties sold for an average of £230,796, with terraced properties fetching £120,273.
Overall, the historical sold prices in Riddings over the last year were 3% up on the previous year and similar to the 2022 peak of £170,673.
Properties Sold
16, Headingley Avenue, Scunthorpe DN17 2GL
| Today | See what it's worth now |
| 6 Mar 2026 | £175,000 |
| 5 May 2006 | £127,000 |
10, Roman Way, Scunthorpe DN17 2FD
| Today | See what it's worth now |
| 27 Feb 2026 | £137,000 |
| 24 May 2013 | £116,000 |
19, Burringham Road, Scunthorpe DN17 2BA
| Today | See what it's worth now |
| 27 Feb 2026 | £200,000 |
| 1 May 2015 | £95,000 |
No other historical records.
1, Keelby Road, Scunthorpe DN17 2NE
| Today | See what it's worth now |
| 27 Feb 2026 | £142,000 |
| 25 Sep 2012 | £79,500 |
97b, Moorwell Road, Yaddlethorpe, Scunthorpe DN17 2SX
| Today | See what it's worth now |
| 20 Feb 2026 | £380,000 |
| 13 Oct 2000 | £68,000 |
No other historical records.
22, Coningsby Road, Scunthorpe DN17 2HJ
| Today | See what it's worth now |
| 10 Feb 2026 | £210,000 |
| 30 Oct 2014 | £89,000 |
4, Harrow Gardens, Scunthorpe DN17 2PD
| Today | See what it's worth now |
| 9 Feb 2026 | £130,000 |
| 19 Aug 2016 | £97,000 |
No other historical records.
30, Ontario Road, Scunthorpe DN17 2TQ
| Today | See what it's worth now |
| 6 Feb 2026 | £192,500 |
| 24 Feb 2023 | £152,500 |
8, Montbretia Drive, Scunthorpe DN17 2GD
| Today | See what it's worth now |
| 2 Feb 2026 | £143,000 |
| 15 Jun 2001 | £126,995 |
No other historical records.
375, Messingham Road, Scunthorpe DN17 2QZ

| Today | See what it's worth now |
| 30 Jan 2026 | £200,000 |
| 7 Sep 2007 | £136,000 |
135, Burringham Road, Scunthorpe DN17 2DF
| Today | See what it's worth now |
| 30 Jan 2026 | £152,000 |
| 27 Nov 2015 | £118,000 |
379, Messingham Road, Bottesford DN17 2QZ
| Today | See what it's worth now |
| 26 Jan 2026 | £160,000 |
No other historical records.
Morley, Burringham Road, Ashby Parklands, Scunthorpe DN17 2AA
| Today | See what it's worth now |
| 23 Jan 2026 | £120,000 |
No other historical records.
33, Fotherby Road, Scunthorpe DN17 2NL
| Today | See what it's worth now |
| 19 Jan 2026 | £169,950 |
| 21 Mar 2002 | £37,000 |
No other historical records.
373, Messingham Road, Bottesford DN17 2QZ
| Today | See what it's worth now |
| 16 Jan 2026 | £100,000 |
No other historical records.
2, Balmoral Court, Scunthorpe DN17 2QN
| Today | See what it's worth now |
| 15 Jan 2026 | £130,000 |
| 9 Aug 2022 | £162,000 |
28, Messingham Road, Scunthorpe DN17 2DA
| Today | See what it's worth now |
| 9 Jan 2026 | £113,000 |
| 25 Oct 2019 | £97,500 |
25, Ancaster Court, Scunthorpe DN17 2DD
| Today | See what it's worth now |
| 23 Dec 2025 | £127,500 |
No other historical records.
4, Bolingbroke Road, Scunthorpe DN17 2NH

| Today | See what it's worth now |
| 19 Dec 2025 | £148,799 |
| 21 Feb 2022 | £160,000 |
16, Ottawa Road, Scunthorpe DN17 2TG
| Today | See what it's worth now |
| 16 Dec 2025 | £210,000 |
| 30 Nov 1995 | £38,500 |
No other historical records.
3, St Davids Crescent, Scunthorpe DN17 2SR

| Today | See what it's worth now |
| 16 Dec 2025 | £174,000 |
| 7 Sep 2018 | £132,500 |
20, Churchill Road, Scunthorpe DN17 2EB
| Today | See what it's worth now |
| 12 Dec 2025 | £150,000 |
| 25 Oct 2024 | £145,000 |
122, Moorwell Road, Yaddlethorpe, Scunthorpe DN17 2SY
| Today | See what it's worth now |
| 5 Dec 2025 | £195,000 |
| 28 Oct 2016 | £135,000 |
55, Angerstein Road, Scunthorpe DN17 2LY
| Today | See what it's worth now |
| 4 Dec 2025 | £150,000 |
| 3 Apr 2009 | £82,500 |
89, Burringham Road, Scunthorpe DN17 2DF
| Today | See what it's worth now |
| 2 Dec 2025 | £175,000 |
| 25 Nov 2022 | £180,000 |
Source Acknowledgement: © Crown copyright. England and Wales house price data is publicly available information produced by the HM Land Registry.This material was last updated on 15 May 2026. It covers the period from 1 January 1995 to 31 March 2026 and contains property transactions which have been registered during that period. Contains HM Land Registry data © Crown copyright and database right 2026. This data is licensed under the Open Government Licence v3.0.
Disclaimer: Rightmove.co.uk provides this HM Land Registry data "as is". The burden for fitness of the data relies completely with the user and is provided for informational purposes only. No warranty, express or implied, is given relating to the accuracy of content of the HM Land Registry data and Rightmove does not accept any liability for error or omission. If you have found an error with the data or need further information please contact HM Land Registry.
Permitted Use: Viewers of this Information are granted permission to access this Crown copyright material and to download it onto electronic, magnetic, optical or similar storage media provided that such activities are for private research, study or in-house use only. Any other use of the material requires the formal written permission of Land Registry which can be requested from us, and is subject to an additional licence and associated charge.
Map data ©OpenStreetMap contributors.
Rightmove takes no liability for your use of, or reliance on, Rightmove's Instant Valuation due to the limitations of our tracking tool listed here. Use of this tool is taken entirely at your own risk. All rights reserved.