
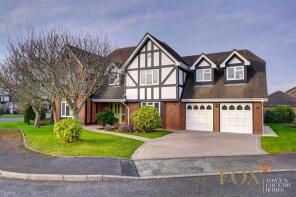
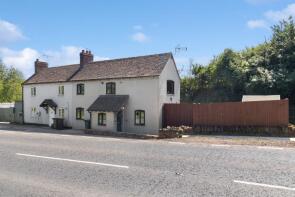
House Prices in Ridgeway Cross
House prices in Ridgeway Cross have an overall average of £433,548 over the last year.
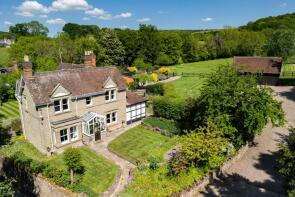
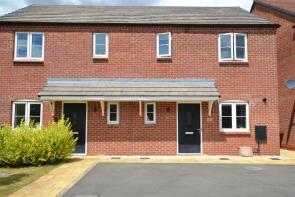
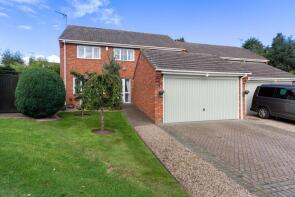
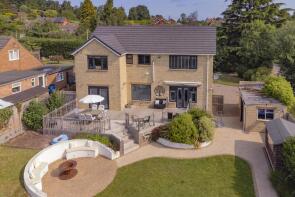
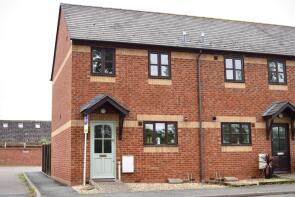
The majority of properties sold in Ridgeway Cross during the last year were detached properties, selling for an average price of £517,698. Semi-detached properties sold for an average of £254,000, with terraced properties fetching £291,500.
Overall, the historical sold prices in Ridgeway Cross over the last year were 11% down on the previous year and 10% down on the 2022 peak of £479,259.
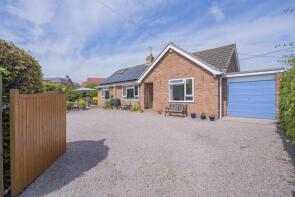
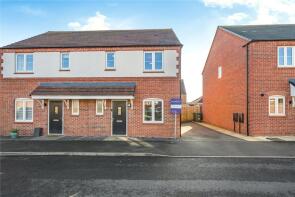
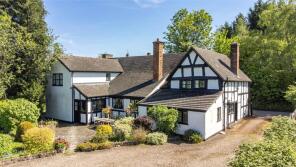
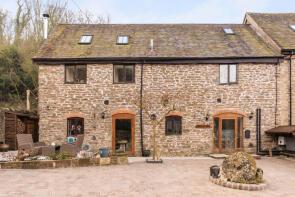
Properties Sold
11, Nash Green, Malvern WR13 5DR
| Today | See what it's worth now |
| 13 Mar 2026 | £635,000 |
| 3 Dec 2013 | £499,950 |
No other historical records.
25, Pixiefields, Malvern WR13 5ND
| Today | See what it's worth now |
| 26 Feb 2026 | £300,000 |
| 7 Jul 2015 | £196,000 |
No other historical records.
12, Credenleigh, Malvern WR13 5NB
| Today | See what it's worth now |
| 12 Feb 2026 | £270,000 |
| 30 Oct 2020 | £200,000 |
Stoney Villa, Cradley WR13 5LQ
| Today | See what it's worth now |
| 12 Feb 2026 | £980,000 |
No other historical records.
1, Bridge End Cottage, A4103 From Old Roman Road To Halesend Grittles End, Malvern WR13 5NN
| Today | See what it's worth now |
| 9 Jan 2026 | £230,000 |
| 26 Feb 2021 | £185,000 |
7, Pyndar Court, C2102 Newland, Malvern WR13 5AX
| Today | See what it's worth now |
| 18 Dec 2025 | £255,000 |
| 19 Jun 2020 | £195,000 |
Hawkridge Cottage, B4220 From Hawridge Cottage T0 A4103, Malvern WR13 5JJ
| Today | See what it's worth now |
| 9 Dec 2025 | £565,000 |
| 19 Jul 2023 | £585,000 |
9, Nash Green, Leigh Sinton WR13 5DR
| Today | See what it's worth now |
| 5 Dec 2025 | £665,000 |
No other historical records.
The Hoploft, Sherridge Road, Malvern WR13 5DA
| Today | See what it's worth now |
| 5 Dec 2025 | £475,000 |
| 2 Feb 2006 | £390,000 |
No other historical records.
10, Spruce Close, Malvern WR13 5FD
| Today | See what it's worth now |
| 3 Dec 2025 | £196,000 |
| 2 Jun 2023 | £196,000 |
7 Cherry Tree House, Oaklands, Malvern WR13 5LA
| Today | See what it's worth now |
| 28 Nov 2025 | £445,000 |
| 5 Nov 2012 | £295,000 |
Crossways, Chockbury Lane, Cradley WR13 5NA
| Today | See what it's worth now |
| 31 Oct 2025 | £530,000 |
No other historical records.
7, Old Orchard, Hereford Road, Malvern WR13 5EU
| Today | See what it's worth now |
| 21 Oct 2025 | £110,000 |
| 6 Aug 2021 | £92,500 |
Leeside, Credenleigh, Malvern WR13 5NB
| Today | See what it's worth now |
| 20 Oct 2025 | £430,000 |
| 27 Oct 2021 | £368,350 |
14, Norway Close, Malvern WR13 5FE
| Today | See what it's worth now |
| 13 Oct 2025 | £285,000 |
| 11 May 2018 | £269,950 |
No other historical records.
3, Malvern Oaks Close, Malvern WR13 5NE

| Today | See what it's worth now |
| 9 Sep 2025 | £390,000 |
| 31 Mar 2021 | £330,000 |
No other historical records.
The Badgers, Mathon WR13 5PW
| Today | See what it's worth now |
| 1 Sep 2025 | £700,000 |
No other historical records.
37, Kiln Lane, Malvern WR13 5HH
| Today | See what it's worth now |
| 22 Aug 2025 | £387,000 |
| 25 Oct 2019 | £280,000 |
No other historical records.
The Old Cider Mill, The Halesend, Halesend Grittles End, Malvern WR13 5EW
| Today | See what it's worth now |
| 22 Aug 2025 | £509,500 |
| 7 Mar 2022 | £462,000 |
3, Clewer Croft, Malvern WR13 5PJ
| Today | See what it's worth now |
| 18 Aug 2025 | £525,000 |
| 11 Jul 2012 | £312,500 |
34, Kiln Lane, Malvern WR13 5HH
| Today | See what it's worth now |
| 15 Aug 2025 | £412,000 |
| 24 Aug 2007 | £295,000 |
18, Pixiefields, Malvern WR13 5ND
| Today | See what it's worth now |
| 7 Aug 2025 | £350,000 |
| 30 Jan 2004 | £190,000 |
3, Albert Close, Malvern WR13 5BF
| Today | See what it's worth now |
| 6 Aug 2025 | £530,000 |
| 30 Apr 2021 | £440,000 |
No other historical records.

Source Acknowledgement: © Crown copyright. England and Wales house price data is publicly available information produced by the HM Land Registry.This material was last updated on 15 May 2026. It covers the period from 1 January 1995 to 31 March 2026 and contains property transactions which have been registered during that period. Contains HM Land Registry data © Crown copyright and database right 2026. This data is licensed under the Open Government Licence v3.0.
Disclaimer: Rightmove.co.uk provides this HM Land Registry data "as is". The burden for fitness of the data relies completely with the user and is provided for informational purposes only. No warranty, express or implied, is given relating to the accuracy of content of the HM Land Registry data and Rightmove does not accept any liability for error or omission. If you have found an error with the data or need further information please contact HM Land Registry.
Permitted Use: Viewers of this Information are granted permission to access this Crown copyright material and to download it onto electronic, magnetic, optical or similar storage media provided that such activities are for private research, study or in-house use only. Any other use of the material requires the formal written permission of Land Registry which can be requested from us, and is subject to an additional licence and associated charge.
Map data ©OpenStreetMap contributors.
Rightmove takes no liability for your use of, or reliance on, Rightmove's Instant Valuation due to the limitations of our tracking tool listed here. Use of this tool is taken entirely at your own risk. All rights reserved.