
House Prices in Ringway
House prices in Ringway have an overall average of £249,066 over the last year.
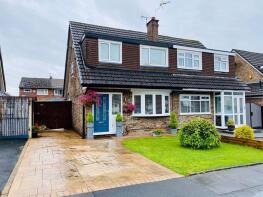
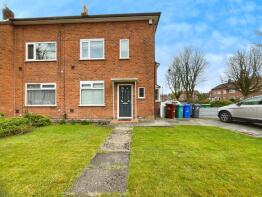
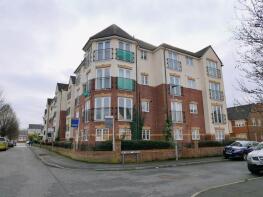
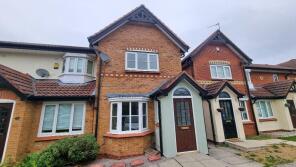
The majority of properties sold in Ringway during the last year were semi-detached properties, selling for an average price of £277,699. Terraced properties sold for an average of £253,110, with flats fetching £149,836.
Overall, the historical sold prices in Ringway over the last year were 3% down on the previous year and 8% up on the 2022 peak of £231,161.
Properties Sold
71, Petworth Close, Manchester M22 4YR
| Today | See what it's worth now |
| 27 Apr 2026 | £219,000 |
| 26 Oct 2001 | £74,950 |
61, Longley Lane, Manchester M22 4JD
| Today | See what it's worth now |
| 17 Apr 2026 | £495,000 |
| 20 Jan 2006 | £299,950 |
No other historical records.
101, Cornishway, Manchester M22 1PA
| Today | See what it's worth now |
| 10 Apr 2026 | £275,000 |
| 18 Jun 2004 | £85,000 |
5, Denville Crescent, Manchester M22 5EW
| Today | See what it's worth now |
| 9 Apr 2026 | £252,000 |
| 10 Feb 2006 | £110,000 |
9, Melvin Avenue, Manchester M22 9US
| Today | See what it's worth now |
| 30 Mar 2026 | £195,000 |
No other historical records.
29, 2 Beech House, Lauriston Close, Manchester M22 4TZ
| Today | See what it's worth now |
| 30 Mar 2026 | £165,000 |
| 30 Apr 2010 | £112,550 |
34, Thirlmere Road, Manchester M22 1NB
| Today | See what it's worth now |
| 27 Mar 2026 | £265,000 |
| 24 Nov 2004 | £117,500 |
10, Haythorp Avenue, Manchester M22 5EN

| Today | See what it's worth now |
| 27 Mar 2026 | £237,500 |
No other historical records.
15, Woodburn Road, Manchester M22 4BZ
| Today | See what it's worth now |
| 27 Mar 2026 | £350,000 |
| 20 May 2003 | £85,000 |
No other historical records.
58, Moat Road, Manchester M22 9HX
| Today | See what it's worth now |
| 27 Mar 2026 | £240,000 |
| 27 Apr 2023 | £210,000 |
No other historical records.
23, Harrier Close, Manchester M22 4XN
| Today | See what it's worth now |
| 25 Mar 2026 | £301,000 |
| 26 Feb 2016 | £169,500 |
10, Govan Street, Manchester M22 4HA
| Today | See what it's worth now |
| 24 Mar 2026 | £275,000 |
| 4 Mar 2021 | £235,000 |
61, Bronington Close, Manchester M22 4ZR
| Today | See what it's worth now |
| 20 Mar 2026 | £395,000 |
| 25 Jun 2004 | £169,950 |
25, Starling Close, Manchester M22 4XS
| Today | See what it's worth now |
| 17 Mar 2026 | £266,000 |
| 1 Dec 2017 | £173,500 |
Flat 11, 55 Belvedere Square, Peel Hall Road, Manchester M22 5DT

| Today | See what it's worth now |
| 13 Mar 2026 | £132,500 |
| 22 Aug 2005 | £105,000 |
20, Carling Drive, Manchester M22 5GG
| Today | See what it's worth now |
| 12 Mar 2026 | £300,000 |
| 28 Feb 2018 | £183,500 |
85, Cornishway, Manchester M22 0EZ
| Today | See what it's worth now |
| 12 Mar 2026 | £145,000 |
| 12 Jun 2014 | £82,500 |
Flat 33, 28, Sandycroft Avenue, Manchester M22 9AL
| Today | See what it's worth now |
| 6 Mar 2026 | £115,000 |
| 24 Sep 2004 | £105,995 |
No other historical records.
Flat 5, 5, Cedarwood Close, Manchester M22 4QJ

| Today | See what it's worth now |
| 6 Mar 2026 | £10,000 |
| 6 Mar 2026 | £10,000 |
7, Lambourne Close, Manchester M22 1HS
| Today | See what it's worth now |
| 6 Mar 2026 | £222,500 |
| 31 Aug 2006 | £135,000 |
No other historical records.
9, Garland Road, Manchester M22 5FF
| Today | See what it's worth now |
| 5 Mar 2026 | £247,500 |
No other historical records.
13, The Old Courtyard, Manchester M22 4YD
| Today | See what it's worth now |
| 5 Mar 2026 | £315,000 |
| 12 Apr 2019 | £225,000 |
Flat 22, 3, Sheen Gardens, Manchester M22 5LE
| Today | See what it's worth now |
| 5 Mar 2026 | £145,000 |
| 12 Dec 2013 | £114,500 |
Source Acknowledgement: © Crown copyright. England and Wales house price data is publicly available information produced by the HM Land Registry.This material was last updated on 9 July 2026. It covers the period from 1 January 1995 to 30 April 2026 and contains property transactions which have been registered during that period. Contains HM Land Registry data © Crown copyright and database right 2026. This data is licensed under the Open Government Licence v3.0.
Disclaimer: Rightmove.co.uk provides this HM Land Registry data "as is". The burden for fitness of the data relies completely with the user and is provided for informational purposes only. No warranty, express or implied, is given relating to the accuracy of content of the HM Land Registry data and Rightmove does not accept any liability for error or omission. If you have found an error with the data or need further information please contact HM Land Registry.
Permitted Use: Viewers of this Information are granted permission to access this Crown copyright material and to download it onto electronic, magnetic, optical or similar storage media provided that such activities are for private research, study or in-house use only. Any other use of the material requires the formal written permission of Land Registry which can be requested from us, and is subject to an additional licence and associated charge.
Rightmove takes no liability for your use of, or reliance on, Rightmove's Instant Valuation due to the limitations of our tracking tool listed here. Use of this tool is taken entirely at your own risk. All rights reserved.