
House Prices in Risingbrook
House prices in Risingbrook have an overall average of £232,099 over the last year.
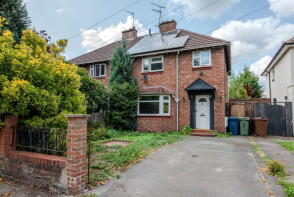
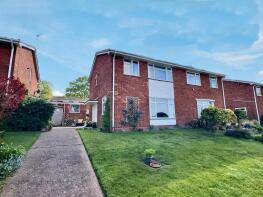
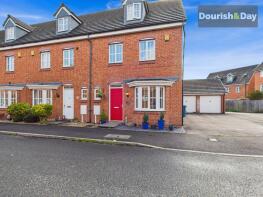
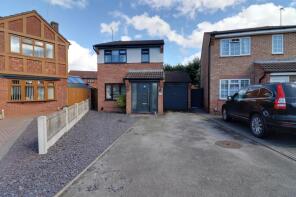
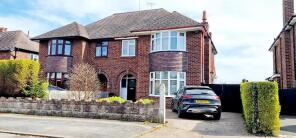
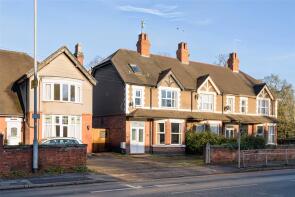
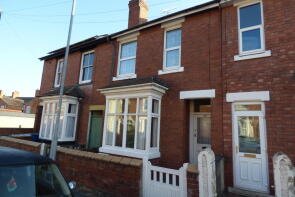
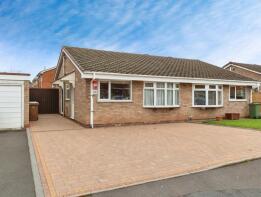
The majority of properties sold in Risingbrook during the last year were semi-detached properties, selling for an average price of £242,862. Terraced properties sold for an average of £182,556, with detached properties fetching £324,229.
Overall, the historical sold prices in Risingbrook over the last year were 1% down on the previous year and similar to the 2023 peak of £230,063.
Properties Sold
66, St Leonards Avenue, Queensville, Stafford ST17 4LT
| Today | See what it's worth now |
| 10 Mar 2026 | £215,000 |
| 26 Apr 2019 | £178,500 |
16, Robinswood, Wildwood, Stafford ST17 4QY
| Today | See what it's worth now |
| 10 Mar 2026 | £205,000 |
| 5 Oct 2018 | £172,000 |
31, Aldersleigh Drive, Wildwood, Stafford ST17 4RY
| Today | See what it's worth now |
| 6 Mar 2026 | £261,000 |
| 28 Feb 2014 | £157,000 |
No other historical records.
29, Anemone Avenue, Stafford ST17 4FW
| Today | See what it's worth now |
| 6 Mar 2026 | £343,000 |
| 24 Sep 2021 | £317,995 |
No other historical records.
73, Garden Street, Stafford ST17 4BT
| Today | See what it's worth now |
| 3 Mar 2026 | £750,000 |
| 12 May 2017 | £650,000 |
9, Quantico Close, Stafford ST17 4LB
| Today | See what it's worth now |
| 27 Feb 2026 | £178,000 |
| 22 Sep 2023 | £162,500 |
No other historical records.
20, Lichfield Road, Stafford ST17 4LJ
| Today | See what it's worth now |
| 27 Feb 2026 | £330,000 |
| 26 Mar 2018 | £215,000 |
No other historical records.
28, New Garden Street, Forebridge, Stafford ST17 4DB
| Today | See what it's worth now |
| 27 Feb 2026 | £173,000 |
| 18 Aug 2020 | £148,000 |
6, The Saplings, Queensville, Stafford ST17 4LH
| Today | See what it's worth now |
| 27 Feb 2026 | £155,000 |
| 4 Feb 2005 | £109,950 |
No other historical records.
18, Pioneer Way, Stafford ST17 4JF

| Today | See what it's worth now |
| 27 Feb 2026 | £248,000 |
| 31 Jan 2022 | £208,000 |
4, Ingestre Road, Forebridge, Stafford ST17 4DJ
| Today | See what it's worth now |
| 27 Feb 2026 | £250,000 |
| 5 Aug 2005 | £135,000 |
28, Stonepine Close, Wildwood, Stafford ST17 4QS
| Today | See what it's worth now |
| 26 Feb 2026 | £250,000 |
| 29 Mar 1996 | £56,000 |
No other historical records.
5, Christopher Terrace, Queensville, Stafford ST17 4LY
| Today | See what it's worth now |
| 26 Feb 2026 | £160,000 |
| 14 May 2004 | £87,000 |
84, Sidney Avenue, Stafford ST17 4EN

| Today | See what it's worth now |
| 23 Feb 2026 | £178,000 |
| 26 May 2000 | £57,500 |
No other historical records.
21, New Garden Street, Forebridge, Stafford ST17 4DB
| Today | See what it's worth now |
| 17 Feb 2026 | £182,000 |
| 22 Feb 2021 | £127,000 |
208, Silkmore Lane, Stafford ST17 4JD
| Today | See what it's worth now |
| 12 Feb 2026 | £190,000 |
| 25 Sep 2015 | £123,000 |
No other historical records.
10, Tallpines, Wildwood, Stafford ST17 4QF
| Today | See what it's worth now |
| 6 Feb 2026 | £240,000 |
| 14 Jan 2022 | £190,000 |
27, Abberley Grove, Stafford ST17 4FE
| Today | See what it's worth now |
| 5 Feb 2026 | £245,000 |
| 19 Mar 2010 | £170,000 |
11, Malvern Close, Queensville, Stafford ST17 4TH
| Today | See what it's worth now |
| 30 Jan 2026 | £265,000 |
| 11 Oct 2019 | £189,995 |
38, Windsor Road, Queensville, Stafford ST17 4PA
| Today | See what it's worth now |
| 29 Jan 2026 | £310,000 |
| 19 Jan 2006 | £200,000 |
21, Lichfield Road, Stafford ST17 4LJ
| Today | See what it's worth now |
| 28 Jan 2026 | £275,000 |
| 2 Oct 2007 | £250,000 |
22, Meyrick Road, Forebridge, Stafford ST17 4DG
| Today | See what it's worth now |
| 16 Jan 2026 | £115,000 |
No other historical records.
9, Woodleyes Crescent, Wildwood, Stafford ST17 4RE
| Today | See what it's worth now |
| 15 Jan 2026 | £220,000 |
| 18 Aug 2004 | £128,000 |
Source Acknowledgement: © Crown copyright. England and Wales house price data is publicly available information produced by the HM Land Registry.This material was last updated on 15 May 2026. It covers the period from 1 January 1995 to 31 March 2026 and contains property transactions which have been registered during that period. Contains HM Land Registry data © Crown copyright and database right 2026. This data is licensed under the Open Government Licence v3.0.
Disclaimer: Rightmove.co.uk provides this HM Land Registry data "as is". The burden for fitness of the data relies completely with the user and is provided for informational purposes only. No warranty, express or implied, is given relating to the accuracy of content of the HM Land Registry data and Rightmove does not accept any liability for error or omission. If you have found an error with the data or need further information please contact HM Land Registry.
Permitted Use: Viewers of this Information are granted permission to access this Crown copyright material and to download it onto electronic, magnetic, optical or similar storage media provided that such activities are for private research, study or in-house use only. Any other use of the material requires the formal written permission of Land Registry which can be requested from us, and is subject to an additional licence and associated charge.
Map data ©OpenStreetMap contributors.
Rightmove takes no liability for your use of, or reliance on, Rightmove's Instant Valuation due to the limitations of our tracking tool listed here. Use of this tool is taken entirely at your own risk. All rights reserved.