
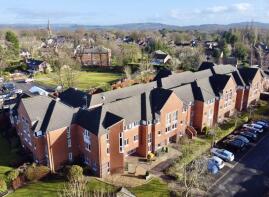
House Prices in Romiley
House prices in Romiley have an overall average of £324,925 over the last year.
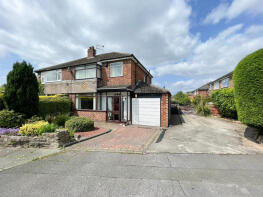
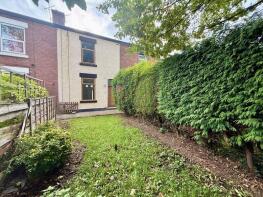
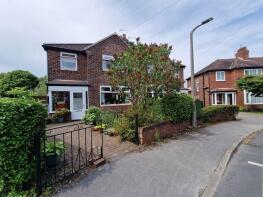
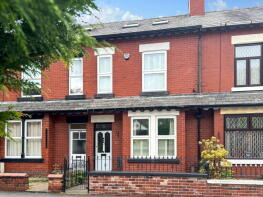
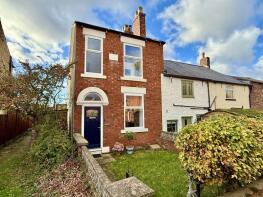
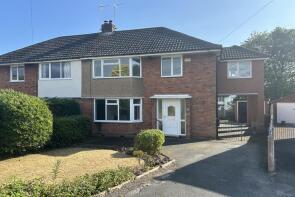
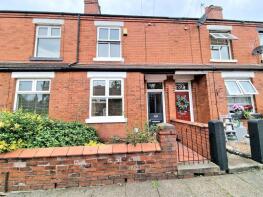
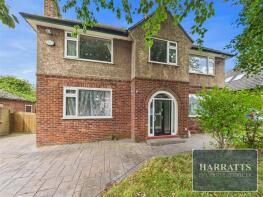
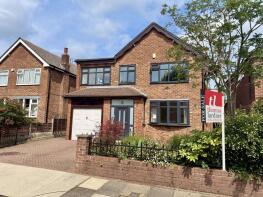
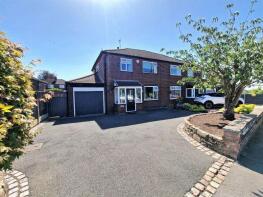
The majority of properties sold in Romiley during the last year were semi-detached properties, selling for an average price of £356,236. Detached properties sold for an average of £450,646, with terraced properties fetching £263,413.
Overall, the historical sold prices in Romiley over the last year were 7% up on the previous year and 7% up on the 2022 peak of £304,982.
Properties Sold
40, Alamein Drive, Romiley, Stockport SK6 4JW
| Today | See what it's worth now |
| 27 Apr 2026 | £265,000 |
| 30 Aug 2017 | £156,500 |
9, Green Lane, Romiley, Stockport SK6 3JG
| Today | See what it's worth now |
| 23 Apr 2026 | £290,000 |
| 27 Oct 2004 | £152,000 |
111, Compstall Road, Romiley, Stockport SK6 4HX
| Today | See what it's worth now |
| 27 Mar 2026 | £390,000 |
| 12 Sep 2002 | £161,700 |
Flat 47, 10 Park View Court, Central Drive, Romiley, Stockport SK6 4QH
| Today | See what it's worth now |
| 27 Mar 2026 | £175,000 |
| 16 Nov 2020 | £140,000 |
174, Sunfield, Romiley, Stockport SK6 4QS

| Today | See what it's worth now |
| 26 Mar 2026 | £120,000 |
No other historical records.
11, Catherine Road, Romiley, Stockport SK6 3DQ
| Today | See what it's worth now |
| 23 Mar 2026 | £295,000 |
No other historical records.
3, John's Place, Romiley, Stockport SK6 4BP
| Today | See what it's worth now |
| 16 Mar 2026 | £210,000 |
| 28 Mar 2018 | £139,950 |
No other historical records.
29, Beacon Road, Romiley, Stockport SK6 3ET
| Today | See what it's worth now |
| 6 Mar 2026 | £475,000 |
| 13 Dec 2005 | £188,500 |
No other historical records.
9, The Quadrant, Bredbury, Stockport SK6 3AY
| Today | See what it's worth now |
| 2 Mar 2026 | £290,000 |
No other historical records.
Flat 3, Davies Court, Metcalfe Drive, Romiley, Stockport SK6 3BG
| Today | See what it's worth now |
| 2 Mar 2026 | £190,000 |
| 31 Mar 2017 | £151,000 |
33, Lyme Grove, Romiley, Stockport SK6 4DH
| Today | See what it's worth now |
| 27 Feb 2026 | £295,000 |
| 7 May 2024 | £238,000 |
No other historical records.
Flat 17, Davies Court, Metcalfe Drive, Romiley, Stockport SK6 3BG
| Today | See what it's worth now |
| 27 Feb 2026 | £125,000 |
| 23 Nov 2018 | £100,000 |
45, Stockport Road, Romiley, Stockport SK6 3AA
| Today | See what it's worth now |
| 27 Feb 2026 | £150,000 |
| 27 Feb 2015 | £125,000 |
Flat 31, Davies Court, Metcalfe Drive, Romiley, Stockport SK6 3BG
| Today | See what it's worth now |
| 27 Feb 2026 | £115,000 |
| 25 Nov 2005 | £134,450 |
No other historical records.
Flat 30, Metcalfe Court, Metcalfe Drive, Romiley, Stockport SK6 3BF
| Today | See what it's worth now |
| 24 Feb 2026 | £191,000 |
| 5 Sep 2022 | £185,000 |
11, Barlow Fold Road, Romiley, Stockport SK6 4LH

| Today | See what it's worth now |
| 23 Feb 2026 | £569,000 |
| 3 Jun 2021 | £442,000 |
No other historical records.
8, Church Lane, Romiley, Stockport SK6 4AA
| Today | See what it's worth now |
| 23 Feb 2026 | £399,000 |
| 14 Nov 2022 | £365,000 |
6, Bonnyfield, Romiley, Stockport SK6 3AR
| Today | See what it's worth now |
| 23 Feb 2026 | £300,000 |
| 15 Jan 2021 | £230,000 |
10, Crossmoor Crescent, Romiley, Stockport SK6 4AG
| Today | See what it's worth now |
| 23 Feb 2026 | £400,000 |
No other historical records.
32, Birch Avenue, Romiley, Stockport SK6 4DG
| Today | See what it's worth now |
| 20 Feb 2026 | £250,000 |
| 17 Jul 1998 | £39,000 |
No other historical records.
14, Bredbury Green, Romiley, Stockport SK6 3DN
| Today | See what it's worth now |
| 13 Feb 2026 | £460,000 |
No other historical records.
47, Compstall Road, Romiley, Stockport SK6 4DB

| Today | See what it's worth now |
| 13 Feb 2026 | £425,000 |
| 18 Sep 1998 | £67,000 |
No other historical records.
4, Stonemead, Romiley, Stockport SK6 4LP
| Today | See what it's worth now |
| 10 Feb 2026 | £550,000 |
| 3 Dec 2007 | £290,000 |
Source Acknowledgement: © Crown copyright. England and Wales house price data is publicly available information produced by the HM Land Registry.This material was last updated on 9 July 2026. It covers the period from 1 January 1995 to 30 April 2026 and contains property transactions which have been registered during that period. Contains HM Land Registry data © Crown copyright and database right 2026. This data is licensed under the Open Government Licence v3.0.
Disclaimer: Rightmove.co.uk provides this HM Land Registry data "as is". The burden for fitness of the data relies completely with the user and is provided for informational purposes only. No warranty, express or implied, is given relating to the accuracy of content of the HM Land Registry data and Rightmove does not accept any liability for error or omission. If you have found an error with the data or need further information please contact HM Land Registry.
Permitted Use: Viewers of this Information are granted permission to access this Crown copyright material and to download it onto electronic, magnetic, optical or similar storage media provided that such activities are for private research, study or in-house use only. Any other use of the material requires the formal written permission of Land Registry which can be requested from us, and is subject to an additional licence and associated charge.
Rightmove takes no liability for your use of, or reliance on, Rightmove's Instant Valuation due to the limitations of our tracking tool listed here. Use of this tool is taken entirely at your own risk. All rights reserved.