
House Prices in Roughmussel
House prices in Roughmussel have an overall average of £221,644 over the last year.
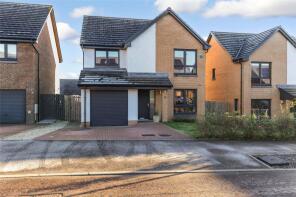
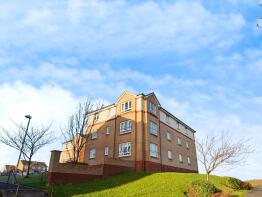
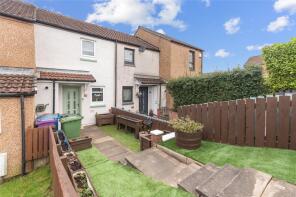
The majority of properties sold in Roughmussel during the last year were semi-detached properties, selling for an average price of £211,822. Detached properties sold for an average of £321,942, with flats fetching £135,789.
Overall, the historical sold prices in Roughmussel over the last year were 8% up on the previous year and 7% up on the 2022 peak of £206,729.
Properties Sold
127, Parklands Oval, Glasgow G53 7UE
| Today | See what it's worth now |
| 30 Apr 2026 | £290,225 |
| 16 Jul 2014 | £171,700 |
11, Darnley Mill Crescent, Glasgow G53 7AZ
| Today | See what it's worth now |
| 24 Apr 2026 | £340,000 |
| 3 Feb 2022 | £274,000 |
No other historical records.
Flat 2/3, 33, Whitehaugh Road, Glasgow G53 7JQ
| Today | See what it's worth now |
| 21 Apr 2026 | £167,500 |
| 21 Mar 2022 | £130,000 |
53, Willowford Place, Glasgow G53 7ZU
| Today | See what it's worth now |
| 21 Apr 2026 | £215,100 |
| 7 Jun 2022 | £193,000 |
9, Bruntsfield Gardens, Glasgow G53 7QJ
| Today | See what it's worth now |
| 21 Apr 2026 | £150,100 |
| 4 Sep 2007 | £86,500 |
No other historical records.
26, Mulben Place, Glasgow G53 7UQ
| Today | See what it's worth now |
| 21 Apr 2026 | £130,000 |
| 13 Jun 2023 | £105,000 |
No other historical records.
20a, Whitehaugh Road, Glasgow G53 7ZN
| Today | See what it's worth now |
| 17 Apr 2026 | £256,000 |
No other historical records.
40, Langford Drive, Glasgow G53 7HU
| Today | See what it's worth now |
| 16 Apr 2026 | £170,000 |
| 22 Aug 2023 | £122,717 |
No other historical records.
22, Parkdale Way, Glasgow G53 7ZJ
| Today | See what it's worth now |
| 14 Apr 2026 | £360,000 |
| 15 Nov 2007 | £213,000 |
No other historical records.
2, Woodhead Path, Glasgow G53 7DB
| Today | See what it's worth now |
| 13 Apr 2026 | £190,000 |
No other historical records.
31, Waukglen Drive, Glasgow G53 7UG
| Today | See what it's worth now |
| 9 Apr 2026 | £224,999 |
| 12 Sep 2024 | £195,000 |
No other historical records.
2, Langhaul Court, Glasgow G53 7RU
| Today | See what it's worth now |
| 8 Apr 2026 | £460,000 |
| 29 Oct 2004 | £340,000 |
No other historical records.
6, Staybrae Drive, Glasgow G53 7SW
| Today | See what it's worth now |
| 3 Apr 2026 | £455,000 |
| 5 Mar 2024 | £435,000 |
No other historical records.
55, Brentwood Drive, Glasgow G53 7UJ
| Today | See what it's worth now |
| 2 Apr 2026 | £159,000 |
| 26 Feb 2024 | £133,500 |
46, Darnley Mill Crescent, Glasgow G53 7AZ
| Today | See what it's worth now |
| 1 Apr 2026 | £287,000 |
| 7 Apr 2022 | £246,000 |
No other historical records.
6, Seamill Street, Glasgow G53 7AY
| Today | See what it's worth now |
| 31 Mar 2026 | £105,105 |
| 16 Jun 2004 | £46,000 |
No other historical records.
36, Brentwood Drive, Glasgow G53 7UJ
| Today | See what it's worth now |
| 30 Mar 2026 | £155,000 |
| 5 Oct 2010 | £84,995 |
18, Whitehaugh Road, Glasgow G53 7ZN
| Today | See what it's worth now |
| 30 Mar 2026 | £232,500 |
| 21 Dec 2020 | £188,000 |
48, Colwood Avenue, Glasgow G53 7XT
| Today | See what it's worth now |
| 26 Mar 2026 | £151,000 |
No other historical records.
37, Bullwood Drive, Glasgow G53 7BU
| Today | See what it's worth now |
| 16 Mar 2026 | £365,125 |
| 15 Jun 2020 | £255,600 |
No other historical records.
8, Glen Dene Way, Glasgow G53 7GS
| Today | See what it's worth now |
| 11 Mar 2026 | £228,000 |
| 25 Sep 2008 | £160,000 |
12, Newtyle Drive, Glasgow G53 7SF
| Today | See what it's worth now |
| 11 Mar 2026 | £330,000 |
No other historical records.
102, Colwood Avenue, Glasgow G53 7XS

| Today | See what it's worth now |
| 9 Mar 2026 | £157,000 |
| 7 Dec 2005 | £95,000 |
No other historical records.

Source Acknowledgement: © Crown copyright. Scottish house price data is publicly available information produced by the Registers of Scotland. Material has been reproduced with the permission of the Keeper of the Registers of Scotland and contains data compiled by Registers of Scotland. For further information, please contact data@ros.gov.uk. Please note the dates shown here relate to the property's registered date not sold date.This material was last updated on 10 July 2026. It covers the period from 8 December 1987 to 30 April 2026 and contains property transactions which have been registered during that period.
Disclaimer: Rightmove.co.uk provides this Registers of Scotland data "as is". The burden for fitness of the data relies completely with the user and is provided for informational purposes only. No warranty, express or implied, is given relating to the accuracy of content of the Registers of Scotland data and Rightmove plc does not accept any liability for error or omission. If you have found an error with the data or need further information please contact data@ros.gov.uk
Permitted Use: The Registers of Scotland allows the reproduction of the data which it provides to Rightmove.co.uk free of charge in any format or medium only for research, private study or for internal circulation within an organisation. This is subject to it being reproduced accurately and not used in a misleading context. The material must be acknowledged as Crown Copyright. You are not allowed to use this information for commercial purposes, nor must you copy, distribute, sell or publish the data in any way. For any other use of this material, please apply to the Registers of Scotland for a licence. You can do this online at www.ros.gov.uk, by email at data@ros.gov.uk or by writing to Business Development, Registers of Scotland, Meadowbank House, 153 London Road, Edinburgh EH8 7AU.
Rightmove takes no liability for your use of, or reliance on, Rightmove's Instant Valuation due to the limitations of our tracking tool listed here. Use of this tool is taken entirely at your own risk. All rights reserved.