
House Prices in Rowhedge
House prices in Rowhedge have an overall average of £327,887 over the last year.
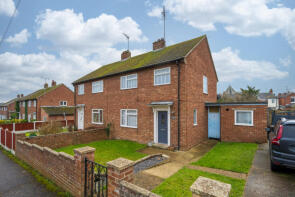
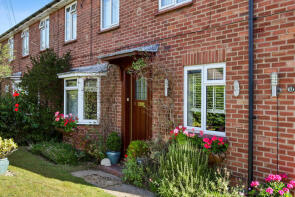
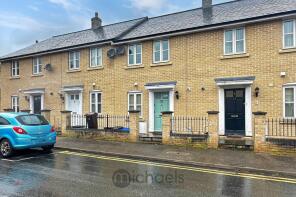
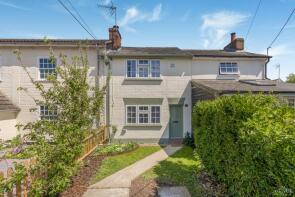
The majority of properties sold in Rowhedge during the last year were semi-detached properties, selling for an average price of £299,091. Detached properties sold for an average of £402,722, with terraced properties fetching £308,111.
Overall, the historical sold prices in Rowhedge over the last year were 6% up on the previous year and 8% up on the 2019 peak of £304,272.
Properties Sold
17, Rectory Road, Colchester CO5 7HR
| Today | See what it's worth now |
| 16 Apr 2026 | £473,000 |
| 30 Mar 2022 | £455,000 |
10, Maritime Approach, Colchester CO5 7BA
| Today | See what it's worth now |
| 27 Mar 2026 | £302,500 |
| 11 Jun 2021 | £270,000 |
1, Marsh Crescent, Colchester CO5 7JQ
| Today | See what it's worth now |
| 13 Mar 2026 | £320,000 |
| 24 Jun 2024 | £310,000 |
24, Rowhedge Wharf Road, Colchester CO5 7DX
| Today | See what it's worth now |
| 6 Mar 2026 | £305,000 |
| 20 Aug 2021 | £280,000 |
No other historical records.
3, Hillview Close, Colchester CO5 7HS
| Today | See what it's worth now |
| 6 Feb 2026 | £350,000 |
| 4 Mar 2021 | £280,000 |
52, High Street, Colchester CO5 7ET
| Today | See what it's worth now |
| 20 Jan 2026 | £262,500 |
| 17 Sep 2004 | £172,500 |
73, Hillview Close, Rowhedge CO5 7HS
| Today | See what it's worth now |
| 16 Dec 2025 | £300,000 |
No other historical records.
6, Silva Walk, Colchester CO5 7DY
| Today | See what it's worth now |
| 12 Dec 2025 | £312,500 |
No other historical records.
162, Rowhedge Road, Rowhedge CO5 7JP
| Today | See what it's worth now |
| 12 Dec 2025 | £700,000 |
No other historical records.
148, Rowhedge Road, Colchester CO5 7JP
| Today | See what it's worth now |
| 12 Dec 2025 | £375,000 |
| 23 Aug 2019 | £308,000 |
No other historical records.
10, Ashurst Close, Rowhedge CO5 7HU
| Today | See what it's worth now |
| 10 Dec 2025 | £212,500 |
No other historical records.
49, Regent Street, Colchester CO5 7EA
| Today | See what it's worth now |
| 8 Dec 2025 | £312,000 |
| 20 Aug 2018 | £290,000 |
31, Maritime Approach, Colchester CO5 7BA
| Today | See what it's worth now |
| 28 Nov 2025 | £390,000 |
| 1 Oct 2018 | £332,995 |
No other historical records.
29, Waterfront Promenade, Colchester CO5 7BB
| Today | See what it's worth now |
| 28 Nov 2025 | £250,000 |
| 26 Jun 2018 | £226,995 |
No other historical records.
33, Colne Rise, Rowhedge CO5 7EJ
| Today | See what it's worth now |
| 24 Nov 2025 | £315,000 |
No other historical records.
3, Colne Rise, Colchester CO5 7EH
| Today | See what it's worth now |
| 14 Nov 2025 | £375,000 |
| 21 Mar 2016 | £233,500 |
No other historical records.
11, Taylors Road, Colchester CO5 7EG
| Today | See what it's worth now |
| 14 Nov 2025 | £210,000 |
| 7 Sep 2007 | £127,500 |
No other historical records.
1a, Parkfield Street, Colchester CO5 7EL
| Today | See what it's worth now |
| 7 Nov 2025 | £255,000 |
| 23 Feb 2023 | £230,000 |
11, Chapel Street, Colchester CO5 7JS
| Today | See what it's worth now |
| 6 Nov 2025 | £225,000 |
| 13 Aug 2004 | £130,000 |
Flat 10, Compass House, Marina Walk, Colchester CO5 7DL

| Today | See what it's worth now |
| 17 Oct 2025 | £227,000 |
| 24 Apr 2020 | £184,995 |
No other historical records.
6, Nautical Way, Colchester CO5 7BZ

| Today | See what it's worth now |
| 23 Sep 2025 | £410,000 |
| 29 Nov 2018 | £292,995 |
No other historical records.
6, Maritime Approach, Colchester CO5 7BA
| Today | See what it's worth now |
| 5 Sep 2025 | £340,000 |
| 25 Feb 2021 | £295,000 |
23, Church Hill, Colchester CO5 7ED
| Today | See what it's worth now |
| 4 Sep 2025 | £271,000 |
| 26 Mar 2021 | £204,000 |
Source Acknowledgement: © Crown copyright. England and Wales house price data is publicly available information produced by the HM Land Registry.This material was last updated on 9 July 2026. It covers the period from 1 January 1995 to 30 April 2026 and contains property transactions which have been registered during that period. Contains HM Land Registry data © Crown copyright and database right 2026. This data is licensed under the Open Government Licence v3.0.
Disclaimer: Rightmove.co.uk provides this HM Land Registry data "as is". The burden for fitness of the data relies completely with the user and is provided for informational purposes only. No warranty, express or implied, is given relating to the accuracy of content of the HM Land Registry data and Rightmove does not accept any liability for error or omission. If you have found an error with the data or need further information please contact HM Land Registry.
Permitted Use: Viewers of this Information are granted permission to access this Crown copyright material and to download it onto electronic, magnetic, optical or similar storage media provided that such activities are for private research, study or in-house use only. Any other use of the material requires the formal written permission of Land Registry which can be requested from us, and is subject to an additional licence and associated charge.
Rightmove takes no liability for your use of, or reliance on, Rightmove's Instant Valuation due to the limitations of our tracking tool listed here. Use of this tool is taken entirely at your own risk. All rights reserved.