
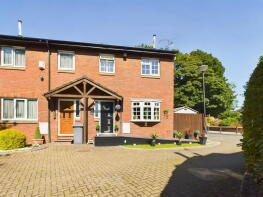
House Prices in Rufford
House prices in Rufford have an overall average of £350,694 over the last year.
The majority of properties sold in Rufford during the last year were detached properties, selling for an average price of £435,000. Semi-detached properties sold for an average of £243,900, with terraced properties fetching £322,600.
Overall, the historical sold prices in Rufford over the last year were 9% down on the previous year and 9% down on the 2023 peak of £383,944.
Properties Sold
10, Riverside Road, Ormskirk L40 1AE
| Today | See what it's worth now |
| 18 Feb 2026 | £275,000 |
| 3 Dec 2020 | £289,995 |
No other historical records.
24, Mill Hey Lane, Ormskirk L40 1SJ
| Today | See what it's worth now |
| 18 Feb 2026 | £580,000 |
| 21 Aug 2015 | £365,000 |
4, Cousins Lane, Ormskirk L40 1TN
| Today | See what it's worth now |
| 9 Feb 2026 | £292,000 |
| 31 Jul 2019 | £174,000 |
No other historical records.
Mon Abri, Smithy Lane, Holmeswood L40 1UH
| Today | See what it's worth now |
| 12 Dec 2025 | £247,500 |
No other historical records.
6 Saddlers Barn, Park Farm, Holmeswood Road, Ormskirk L40 1RZ
| Today | See what it's worth now |
| 10 Dec 2025 | £815,000 |
| 25 Jun 2008 | £505,000 |
6, Hesketh Green, Ormskirk L40 1UN
| Today | See what it's worth now |
| 8 Dec 2025 | £245,000 |
| 20 Nov 2020 | £168,000 |
45, Liverpool Road, Ormskirk L40 1SA
| Today | See what it's worth now |
| 5 Dec 2025 | £200,000 |
| 20 Dec 2007 | £160,000 |
No other historical records.
37, Liverpool Road, Ormskirk L40 1SA
| Today | See what it's worth now |
| 2 Dec 2025 | £185,000 |
| 29 Nov 2002 | £89,000 |
26, Roseacre Gardens, Ormskirk L40 1AA
| Today | See what it's worth now |
| 24 Nov 2025 | £475,000 |
| 11 Feb 2019 | £391,770 |
No other historical records.
33, Liverpool Road, Ormskirk L40 1SA
| Today | See what it's worth now |
| 7 Nov 2025 | £198,000 |
| 21 Jul 2023 | £180,000 |
16, Thornton Close, Ormskirk L40 1UW
| Today | See what it's worth now |
| 31 Oct 2025 | £350,000 |
| 23 May 2002 | £163,000 |
No other historical records.
47, Liverpool Road, Ormskirk L40 1SA
| Today | See what it's worth now |
| 17 Oct 2025 | £170,000 |
| 11 Jan 2023 | £180,000 |
10, Willow Green, Ormskirk L40 1UR
| Today | See what it's worth now |
| 9 Oct 2025 | £315,000 |
| 30 Nov 2018 | £250,000 |
3, Prescott Avenue, Ormskirk L40 1TT
| Today | See what it's worth now |
| 5 Sep 2025 | £270,000 |
| 22 May 2020 | £225,000 |
4, Thornton Close, Ormskirk L40 1UW
| Today | See what it's worth now |
| 27 Aug 2025 | £425,000 |
| 2 Apr 2014 | £240,000 |
259, Liverpool Road, Ormskirk L40 1SD
| Today | See what it's worth now |
| 5 Aug 2025 | £750,000 |
| 31 Aug 2018 | £550,000 |
12, Willow Green, Ormskirk L40 1UR
| Today | See what it's worth now |
| 11 Jul 2025 | £310,000 |
| 1 Mar 2002 | £126,000 |
No other historical records.
79, Highsands Avenue, Rufford L40 1TE
| Today | See what it's worth now |
| 9 Jul 2025 | £210,000 |
No other historical records.
Holly Farm, Holly Lane, Rufford L40 1SH
| Today | See what it's worth now |
| 26 Jun 2025 | £700,000 |
No other historical records.
Soutergate, Holmeswood Road, Rufford L40 1TY
| Today | See what it's worth now |
| 16 Jun 2025 | £230,000 |
No other historical records.
43, Highsands Avenue, Rufford L40 1TE
| Today | See what it's worth now |
| 31 Mar 2025 | £116,000 |
No other historical records.
3, Tootle Lane, Rufford L40 1TJ
| Today | See what it's worth now |
| 31 Mar 2025 | £215,000 |
No other historical records.
43, Liverpool Road, Ormskirk L40 1SA
| Today | See what it's worth now |
| 28 Mar 2025 | £192,500 |
| 29 Apr 2022 | £168,600 |

Source Acknowledgement: © Crown copyright. England and Wales house price data is publicly available information produced by the HM Land Registry.This material was last updated on 9 July 2026. It covers the period from 1 January 1995 to 30 April 2026 and contains property transactions which have been registered during that period. Contains HM Land Registry data © Crown copyright and database right 2026. This data is licensed under the Open Government Licence v3.0.
Disclaimer: Rightmove.co.uk provides this HM Land Registry data "as is". The burden for fitness of the data relies completely with the user and is provided for informational purposes only. No warranty, express or implied, is given relating to the accuracy of content of the HM Land Registry data and Rightmove does not accept any liability for error or omission. If you have found an error with the data or need further information please contact HM Land Registry.
Permitted Use: Viewers of this Information are granted permission to access this Crown copyright material and to download it onto electronic, magnetic, optical or similar storage media provided that such activities are for private research, study or in-house use only. Any other use of the material requires the formal written permission of Land Registry which can be requested from us, and is subject to an additional licence and associated charge.
Rightmove takes no liability for your use of, or reliance on, Rightmove's Instant Valuation due to the limitations of our tracking tool listed here. Use of this tool is taken entirely at your own risk. All rights reserved.